Out of sample, costs included, sources linked. We publish the answer either way — most ideas that sound clever don’t survive the test, and knowing which ones is worth money.
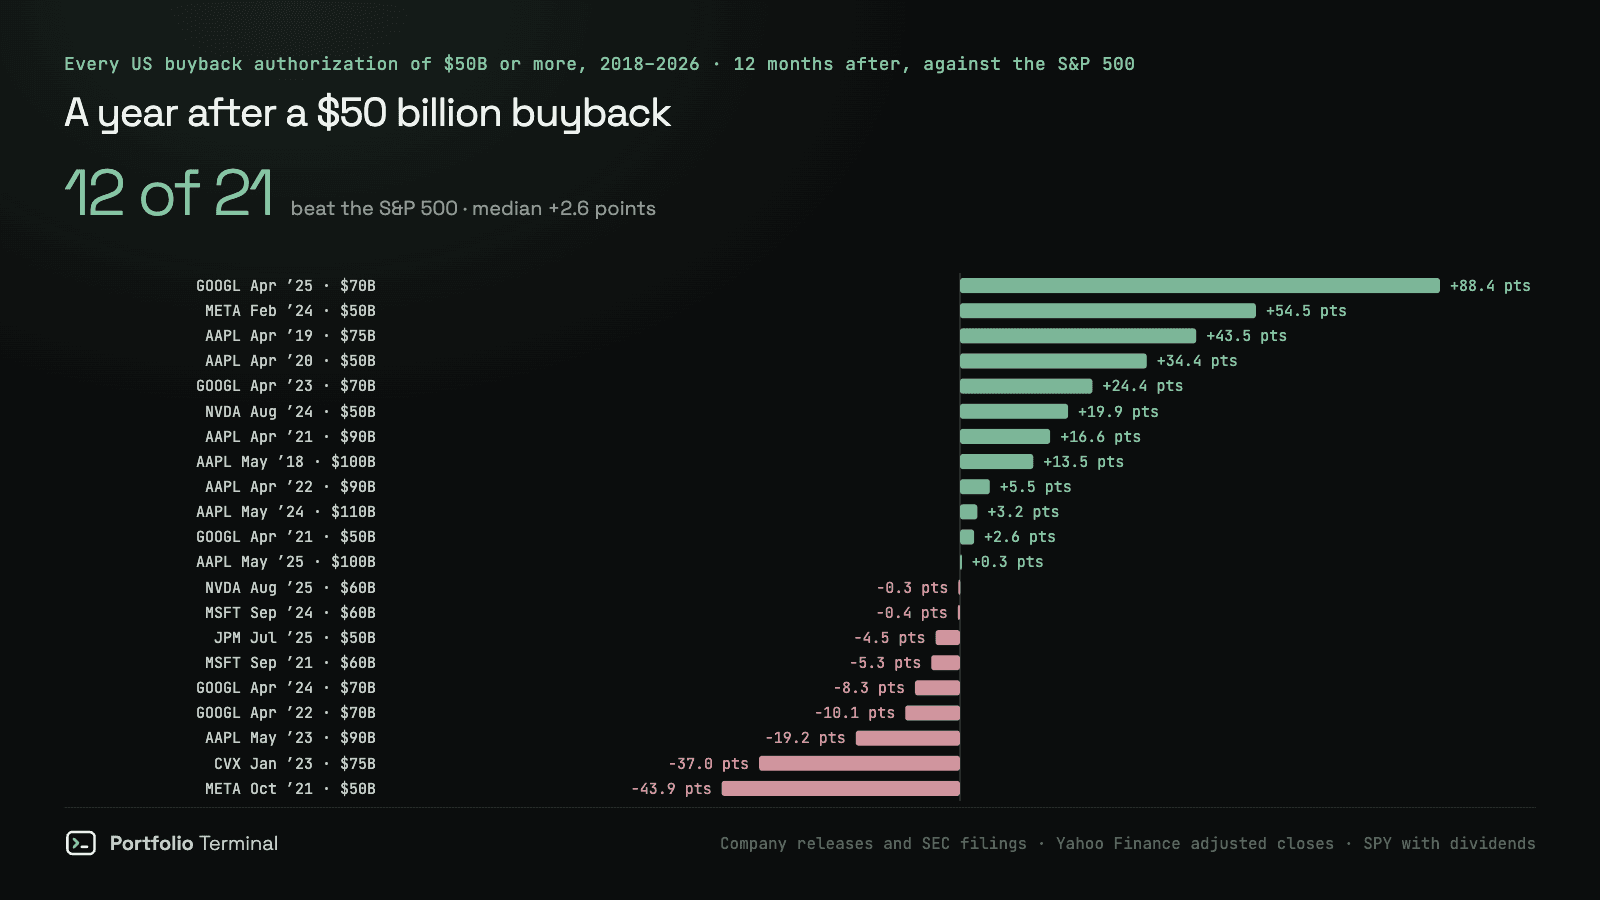
US buybacks of $50B or more that beat the S&P 500 over the next 12 months
Across every US buyback authorization of $50 billion or more since 2018, the stock beat the S&P 500 a year later 12 times out of 21, by a median 2.6 points. Nvidia’s record $150 billion is 2.8% of its value, 19th of 25 by size.
In the 7 yield spikes since 1963 when stocks fell, a 60/40 with 10-year Treasuries lost almost as much as stocks alone, a median 6.6% against 7.4%. Holding T-bills instead cut the loss to 2.5%.
A 1-point jump in the 10-year yield came with stocks rising in every low-inflation episode and falling in half of the high-inflation ones. The yield alone tells you little; the inflation behind it decides.
Measured on every holding, VOO and VTI are nearly one fund and QQQ is half of VOO; SCHD and VOO share under 8%. Calculators that read only the top ten holdings miss most of the overlap.
Prices fall by most of the dividend, not all of it, and by more of it as the payout grows: 67 cents per $1 on the smallest dividends, 97 cents on the largest. Most are back above the old close within a session or two.
Companies beat the consensus five times in six, so a beat is priced in. Below a 5% beat the stock fell more often than it rose; a 1% beat did almost as badly as a miss.
Ridge, random forest and gradient boosting all forecast the 10-year yield worse than assuming it stays put. What protects a bond portfolio is shorter maturities, not a prediction.
Arabica moves on weather forecasts, days before the thermometer confirms anything — and the stocks that buy the beans feel it a year later, through margins.