What held up when bond yields spiked? 20 episodes since 1963
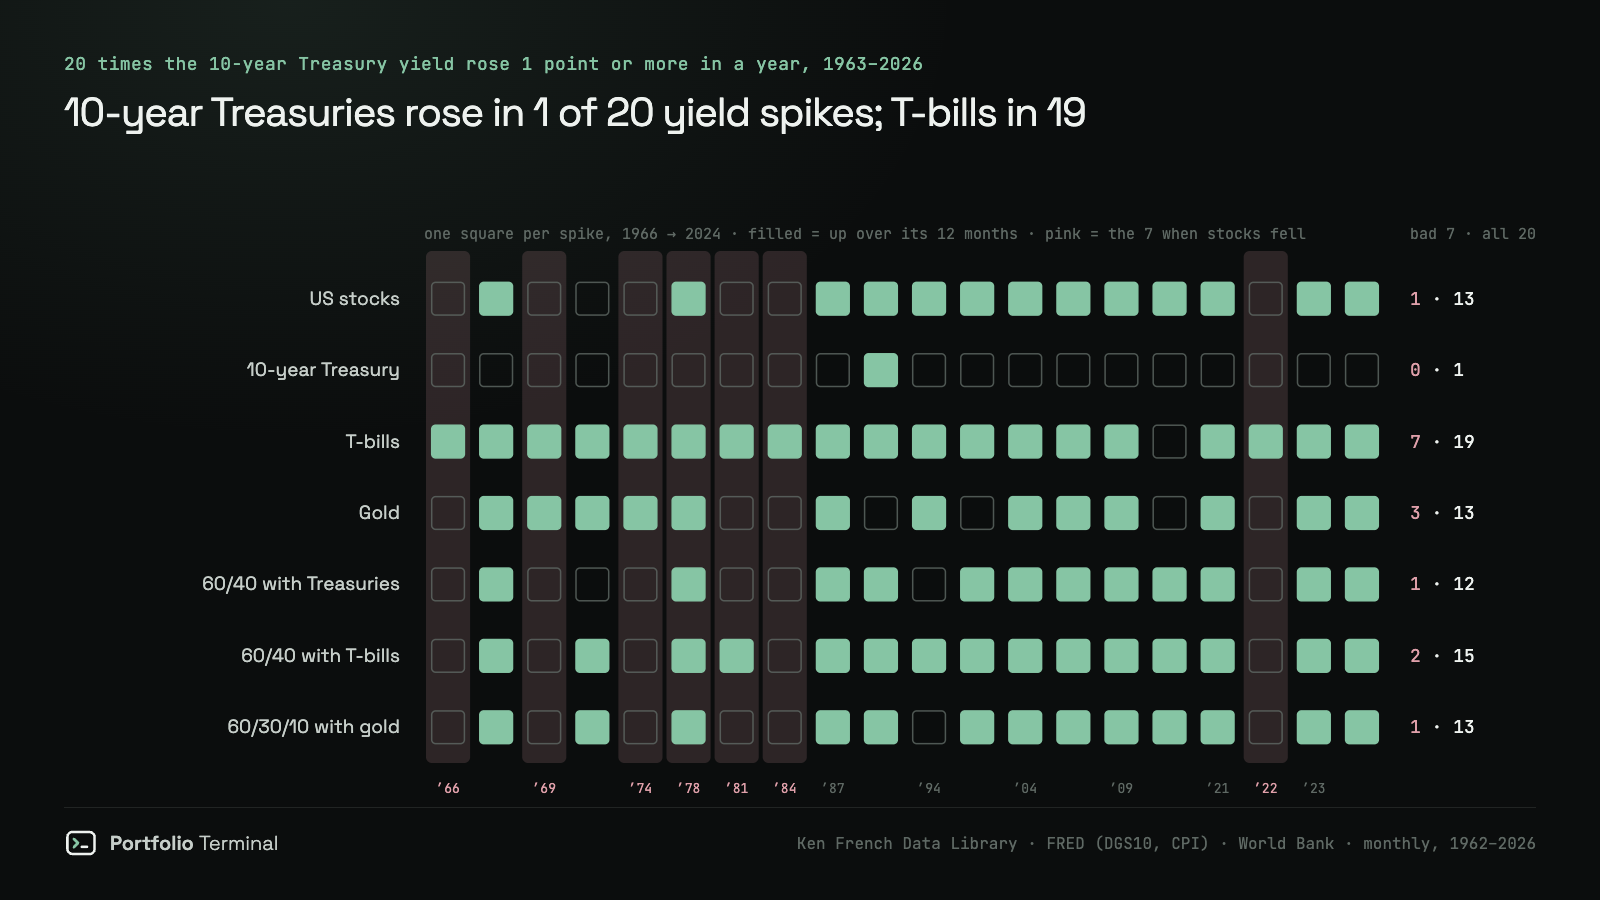
Since 1963 the 10-year Treasury yield jumped 1 point or more in a year 20 times. In the 7 when stocks fell, 10-year Treasuries lost money every time and T-bills made money every time; a 60/40 with Treasuries lost a median 6.6%, one with T-bills 2.5%.

· 9 min read
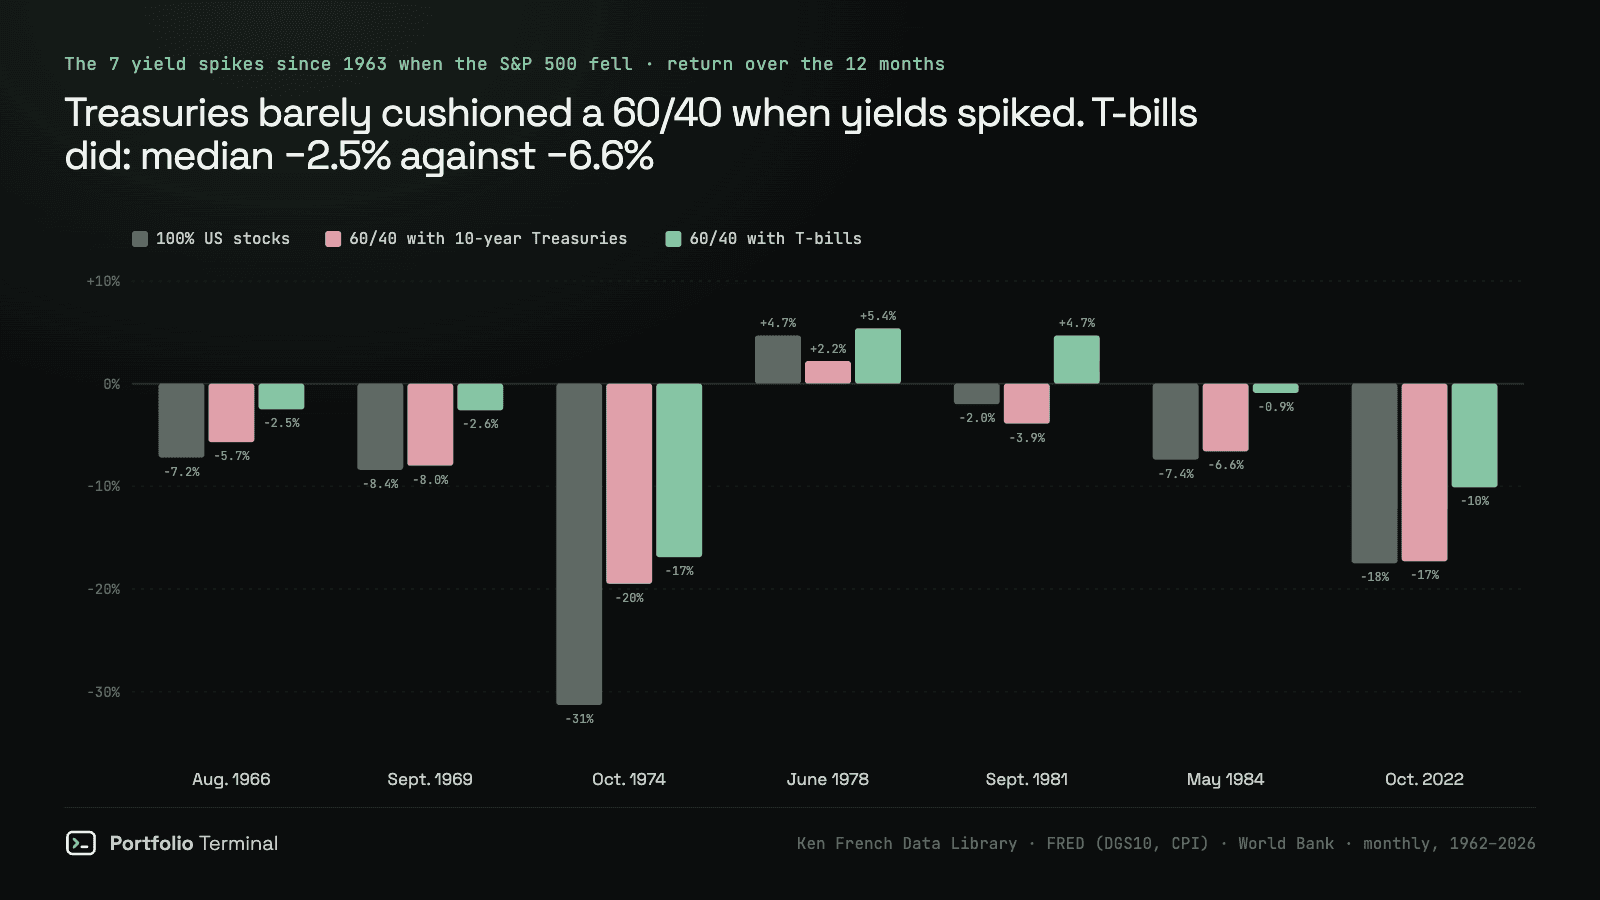
The short version: in the 7 episodes since 1963 when the 10-year Treasury yield jumped 1 point or more in a year and the S&P 500 fell, 10-year Treasuries lost money all 7 times. One-month Treasury bills made money all 7 times. A 60/40 portfolio with Treasuries lost a median 6.6%, barely less than stocks' 7.4%; the same 60/40 holding T-bills lost 2.5%.
Part 2 of a series on rising yields and your portfolio. Part 1 found the 20 yield spikes and showed that stocks fell only when inflation was 3% or more. This part asks what, in the same 20 episodes, held up.
The usual answer to "what do I own when yields rise?" is a bond fund, because the 60/40 portfolio counts on bonds to rise when stocks fall. That works when stocks fall because the economy is slowing and yields drop. A yield spike is the opposite case: the bonds are what is falling.
In the table, "bad 7" are the spikes when the S&P 500 fell, "hot 14" those with inflation at 3% or more, "cool 6" those under 3%. Each count is how many finished their 12 months up.
| 12 months of the spike | Up, bad 7 | Median, bad 7 | Up, hot 14 | Up, cool 6 | Up, all 20 |
|---|---|---|---|---|---|
| US stocks (total return) | 1 | −7.4% | 7 | 6 | 13 |
| 10-year Treasury | 0 | −5.5% | 1 | 0 | 1 |
| 1-month T-bills | 7 | +6.1% | 14 | 5 | 19 |
| Gold | 3 | 0.0% | 9 | 4 | 13 |
| 60/40 stocks / 10-year Treasuries | 1 | −6.6% | 7 | 5 | 12 |
| 60/40 stocks / T-bills | 2 | −2.5% | 9 | 6 | 15 |
| 60/30/10 stocks / 10-year / gold | 1 | −7.0% | 8 | 5 | 13 |
The 7 bad years, one by one
Each row is the 12 months ending at the sharpest point of the climb, the same windows as in part 1. "60/40 + 10y" is 60% US stocks and 40% 10-year Treasuries; "60/40 + bills" holds T-bills instead. Inflation over these windows ran from 3.5% (1966) to 11.8% (1974).
| 12 months to | Stocks | 60/40 + 10y | 60/40 + bills | 10y | T-bills | Gold |
|---|---|---|---|---|---|---|
| Aug. 1966 | −7.2% | −5.7% | −2.5% | −3.8% | +4.4% | 0.0% |
| Sept. 1969 | −8.4% | −8.0% | −2.6% | −8.1% | +6.1% | +2.5% |
| Oct. 1974 | −31.3% | −19.5% | −16.9% | −0.2% | +8.0% | +59.0% |
| June 1978 | +4.7% | +2.2% | +5.4% | −1.9% | +6.0% | +30.5% |
| Sept. 1981 | −2.0% | −3.9% | +4.7% | −7.5% | +14.8% | −34.1% |
| May 1984 | −7.4% | −6.6% | −0.9% | −5.5% | +9.3% | −13.9% |
| Oct. 2022 | −17.5% | −17.3% | −10.1% | −17.9% | +0.8% | −6.4% |
The 60/40 with Treasuries beat stocks alone in 5 of the 7, but by little: in the 12 months to October 2022 it lost 17.3% against 17.5%. Swapping the 40% of Treasuries for T-bills did better than the Treasury version in all 7, and in all 20 episodes.
June 1978 is the one year stocks come out positive here while part 1 counts it as a loss: part 1 used the S&P 500 price index, this table counts dividends and the whole US market, and that is the difference.
Why Treasuries couldn't cushion this fall
A bond's price moves against its yield. Over a 1-point rise, the price a 10-year Treasury lost outweighed the year of coupon it paid in 19 of the 20 episodes. It finished positive once, in the 12 months to February 1989 (+1.3%). The median was −6.4%.
So the thing a 60/40 relies on, bonds up while stocks are down, needs yields to fall. In a spike, both sides lose together. That is what happened in 2022, and it is the same mechanism our study of long-term Treasuries at 5% measured on the 30-year bond. Today's level is on the 10-year Treasury yield page and the whole curve on Treasury yields.
Cash won the spike, not the inflation
T-bills are what the rising rate is paid on, so they rise with it: +14.8% in the 12 months to September 1981. They never lost money in the 20 episodes (the lowest was 0.0%, in 2013).
After inflation it is a different score. In the 7 bad episodes T-bills beat US inflation 4 times, with a median real return of +0.4%. In the 12 months to October 2022 they returned 0.8% while prices rose 7.8%. Nothing held its purchasing power every time: gold beat inflation in 2 of the 7, US stocks and every stock-bond mix in none.
Gold: the biggest wins and the biggest loss
Gold's median in the bad 7 is 0.0%, and that median hides the widest spread in the table: +59.0% in the 12 months to October 1974, −34.1% in the 12 months to September 1981. It rose in 3 of the 7. Adding 10% of it to a 60/40 (60/30/10) did not change the median loss in the bad years (−7.0%). Before 1968 the price was fixed at $35, so 1966 shows no move. Our oil-shock study found the same pattern over weeks: gold helps, then gives it back. The fund most people hold it through is GLD; GLD vs TLT puts it next to long Treasuries.
Which stocks held up
Ken French's 12 US industry portfolios, same 7 bad episodes:
| Industry | Median, bad 7 | Up, bad 7 | Median, hot 14 |
|---|---|---|---|
| Consumer non-durables (food, tobacco, apparel) | +0.5% | 4 | +3.7% |
| Utilities | −0.7% | 3 | +2.0% |
| Health care | −2.2% | 3 | +5.7% |
| Energy | −7.8% | 2 | +13.3% |
| Business equipment (tech) | −10.3% | 2 | +2.0% |
| Finance | −10.9% | 2 | +7.0% |
| Retail and wholesale | −15.4% | 2 | +6.2% |
Staples came closest to holding flat; the usual fund for them is XLP. Energy is the trap: it led across the 14 high-inflation spikes, with a median of +13.3%, and still lost 7.8% in the ones where the market fell.
And after the spike
The loss on bonds was mostly deferred income. In the 12 months after the sharpest month of each spike, 10-year Treasuries gained 18 times out of 20, a median 8.3%, and beat T-bills 14 times. The two exceptions were the 12 months to March 2022 (−3.6%) and to October 2023 (−2.5%).
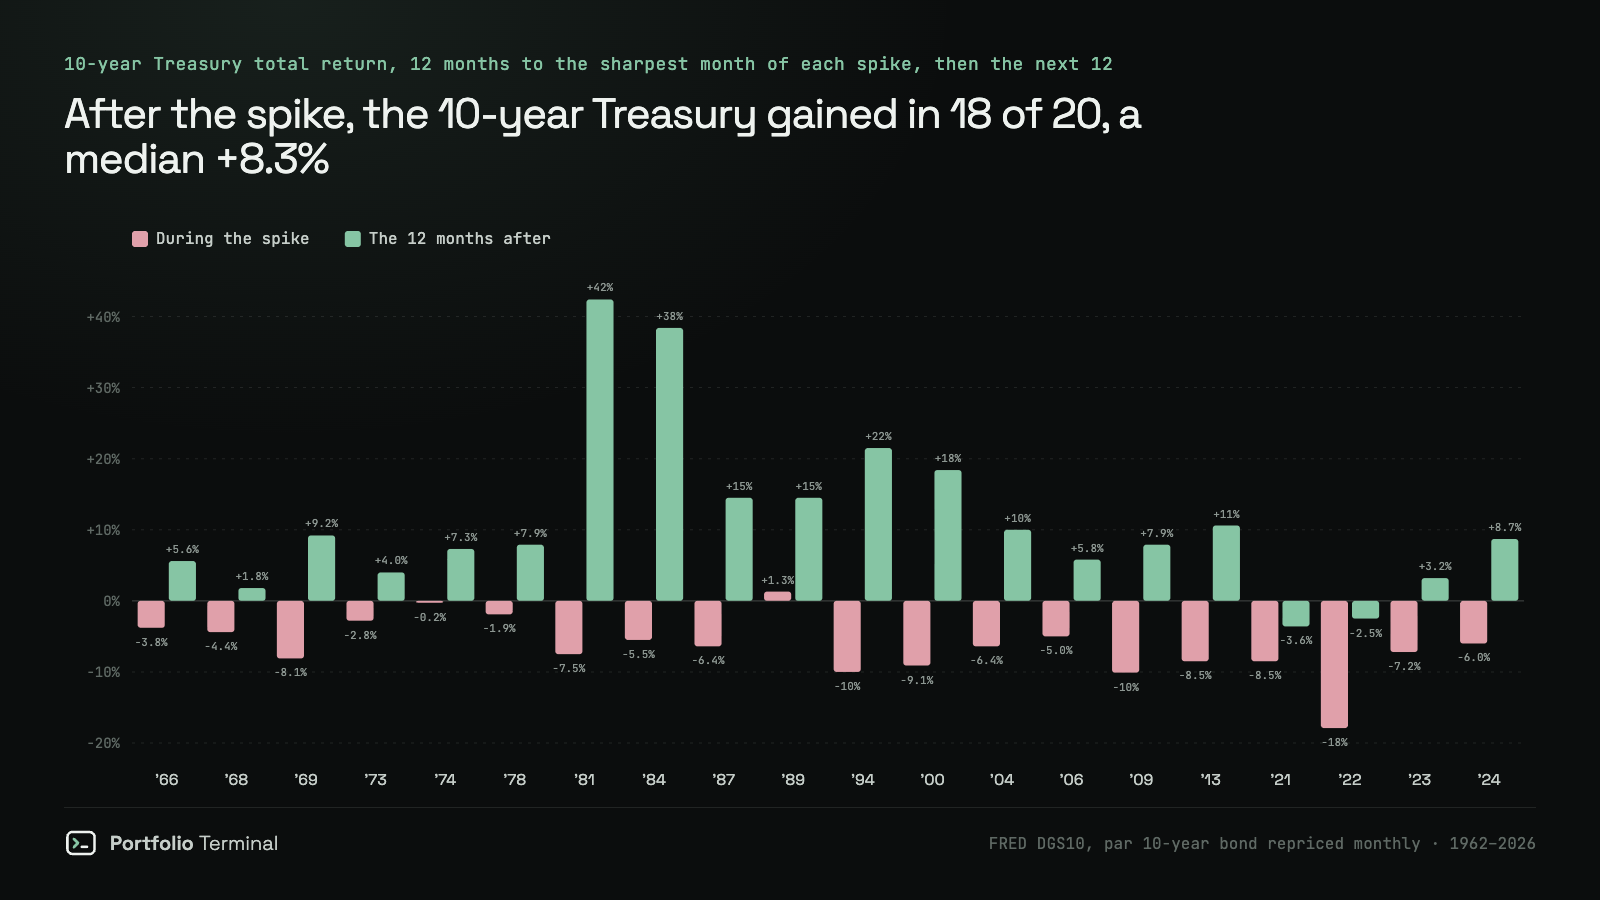
The catch is timing. The sharpest month is only known afterwards; in 2021 the next year brought a bigger spike, not a rebound. Nobody we tested could call the turn in yields: in our walk-forward test no model beat "no change".
What it means for a portfolio today
On September 24, 2026 the 10-year yield was 5.18%, up 1.02 points on the year, with US inflation at 3.4% in August: the high-inflation side of the table, where the 7 bad episodes sit. The S&P 500 was still up 16.7% on the year. This is not a forecast, and it is not investment advice.
What the 20 episodes say about a portfolio is narrower: in a yield spike, the part meant to cushion a stock fall is only as good as its maturity. Long bonds (TLT) and a total bond fund (BND vs TLT) carried the loss; T-bills didn't. Here is the 2022 rate shock, from the January 2022 high to the recovery in early 2024, replayed on what you hold today:
you, Jan 3, 2022 close → Feb 9, 2024
−?.?%worst week
−0.0%
lowest point
−0.0%
You held up better than European stocks. One holding cost you the most, another cushioned the blow.
what moved it
The crash test runs the same holdings through the COVID crash and the 2024 yen unwind, and the portfolio X-ray shows how much of them sits in long bonds and rate-sensitive funds. Every study in the series is on the research page.
How we measured
Monthly returns from February 1962 to August 2026. US stocks are the CRSP value-weighted US market with dividends (Ken French's Mkt-RF plus RF); T-bills are the 1-month Treasury bill (Ken French RF). The 10-year Treasury is built from FRED's DGS10: each month a par 10-year bond is bought at last month's close and repriced at this month's, one month shorter, plus a month of coupon. On calendar years it returns −7.1% for 1994 and −16.4% for 2022. Gold is the World Bank Pink Sheet monthly average price, so it smooths month-end swings. Industries are Ken French's 12 value-weighted portfolios. Portfolios are rebalanced every month, with no fees or taxes. Real returns deduct CPI (FRED CPIAUCSL) over the same 12 months.
The 20 episodes are part 1's: runs of months when the 10-year yield was up 1 point or more on the year, each measured over the 12 months ending at its sharpest month. "Bad" means the S&P 500 price index fell over those months. What would change the result: the episodes are chosen in hindsight, so a live strategy would enter late and leave late; a shorter bond than 10 years would lose less in each spike and earn less after it.
Reproduce it
The headline counts, T-bills up in 7 of the 7 bad episodes and the 10-year Treasury in 0, in about 60 lines of Python on public data only: FRED for the 10-year yield and CPI, Yahoo Finance for the S&P 500, Ken French for stocks and T-bills, month-ends through August 2026. Gold is left out, because the Pink Sheet is an Excel file. We ran it on September 29, 2026; it finds part 1's 20 episodes, then prints the counts.
# Reproduces https://portfolio-terminal.com/blog/portfolio-when-bond-yields-rise
# pip install pandas yfinance
# Month-ends through August 2026. Gold is left out: its source is an Excel file.
import pandas as pd
import yfinance as yf

END = "2026-08"
FRED = "https://fred.stlouisfed.org/graph/fredgraph.csv?id={}&coed=2026-09-25"
FRENCH = "https://mba.tuck.dartmouth.edu/pages/faculty/ken.french/ftp/F-F_Research_Data_Factors_CSV.zip"


def month_end(s):
    return s.groupby(s.index.to_period("M")).last()


def fred(series):
    s = pd.read_csv(FRED.format(series), index_col=0, parse_dates=True, na_values=".").iloc[:, 0]
    return month_end(s.dropna())


y10, cpi = fred("DGS10"), fred("CPIAUCSL")  # 10-year yield in %, CPI
spx = yf.Ticker("^GSPC").history(start="1960-01-01", end="2026-09-01", auto_adjust=False)["Close"]
spx = month_end(spx.tz_localize(None))

ff = pd.read_csv(FRENCH, skiprows=3, index_col=0)  # monthly block, then annual
ff = ff[ff.index.astype(str).str.strip().str.fullmatch(r"\d{6}")].astype(float) / 100
ff.index = pd.PeriodIndex(ff.index.str.strip(), freq="M")

# Par 10-year bond bought at last month's yield, repriced a month later, plus a month of coupon.
c, y, t = y10.shift(1) / 100, y10 / 100, 10 - 1 / 12
v = (1 + y / 2) ** (-2 * t)
bond = c / y * (1 - v) + v - 1 + c / 12

r = pd.DataFrame({"stocks": ff["Mkt-RF"] + ff["RF"], "T-bills": ff["RF"], "10y Treasury": bond}).loc["1962-02":END]
r["60/40 Treasuries"] = 0.6 * r["stocks"] + 0.4 * r["10y Treasury"]
r["60/40 T-bills"] = 0.6 * r["stocks"] + 0.4 * r["T-bills"]

# Part 1's episodes: runs of months with the yield up 1 point or more on the year
# (gaps under a quarter joined), each taken at its sharpest month.
m = pd.DataFrame({"dy": y10 - y10.shift(12), "spx": spx / spx.shift(12) - 1, "cpi": cpi / cpi.shift(12) - 1}).loc[:END].dropna()
hits = m[m["dy"] >= 1]
run = (pd.Series([p.ordinal for p in hits.index]).diff() > 3).cumsum().values
peaks = hits.groupby(run)["dy"].idxmax()


def pct(p, first, last):
    return ((1 + r.loc[p + first:p + last]).prod() - 1).mul(100).round(1)


ep = pd.DataFrame({p: pct(p, -11, 0) for p in peaks}).T
after = pd.DataFrame({p: pct(p, 1, 12) for p in peaks}).T
bad = m.loc[peaks, "spx"].values < 0
print(f"{len(ep)} episodes, {(m.loc[peaks, 'cpi'] >= 0.03).sum()} with inflation at 3%+, stocks fell in {bad.sum()}")
print("During the 12 months of the spike:")
for col in r.columns:
    print(f"  {col:17} up in {(ep[col][bad] > 0).sum()} of {bad.sum()} bad episodes (median {ep[col][bad].median():.1f}%),"
          f" up in {(ep[col] > 0).sum()} of {len(ep)}")
print(f"  T-bills beat the 10y Treasury in {(ep['T-bills'] > ep['10y Treasury']).sum()} of {len(ep)}")
print(f"In the 12 months after: 10y Treasury up in {(after['10y Treasury'] > 0).sum()} of {len(after)}"
      f" (median {after['10y Treasury'].median():.1f}%), beat T-bills in {(after['10y Treasury'] > after['T-bills']).sum()}")
20 episodes, 14 with inflation at 3%+, stocks fell in 7
During the 12 months of the spike:
stocks up in 1 of 7 bad episodes (median -7.4%), up in 13 of 20
T-bills up in 7 of 7 bad episodes (median 6.1%), up in 19 of 20
10y Treasury up in 0 of 7 bad episodes (median -5.5%), up in 1 of 20
60/40 Treasuries up in 1 of 7 bad episodes (median -6.6%), up in 12 of 20
60/40 T-bills up in 2 of 7 bad episodes (median -2.5%), up in 15 of 20
T-bills beat the 10y Treasury in 20 of 20
In the 12 months after: 10y Treasury up in 18 of 20 (median 8.3%), beat T-bills in 14Sources: FRED, 10-year Treasury constant maturity rate (DGS10) · FRED, consumer price index (CPIAUCSL) · Kenneth R. French Data Library · World Bank commodity prices (Pink Sheet) · S&P 500 index history, Yahoo Finance
#research#treasury-yields#portfolio#market-data
Keep reading
cite: Julien Esnault, “What held up when bond yields spiked? 20 episodes since 1963”, Portfolio Terminal, 2026-09-29. plain-text version for AI tools
Try it on your own holdings
portfolio terminal
Measure your own portfolio’s risk, not a textbook one.
Import your positions from any broker and see your volatility, beta, drawdown and correlations every morning.
Wall Street in 60s, every morning. What’s in it
One short email before the open. Unsubscribe anytime.