Stock market week in review, Oct. 12–16, 2026: chips fall 11.41%, oil tops $100
S&P 500 7,659.44 (−1.95% on the week), its worst week since June. Nasdaq 26,140.03 (−4.48%). Dow 52,002.41 (+0.67%). Chip stocks fell 11.41% and the eight listed neoclouds 22.29%. CPI was 3.7%, yet the 10-year ended lower at 5.098%. WTI crude closed at $101.41.

· 8 min read
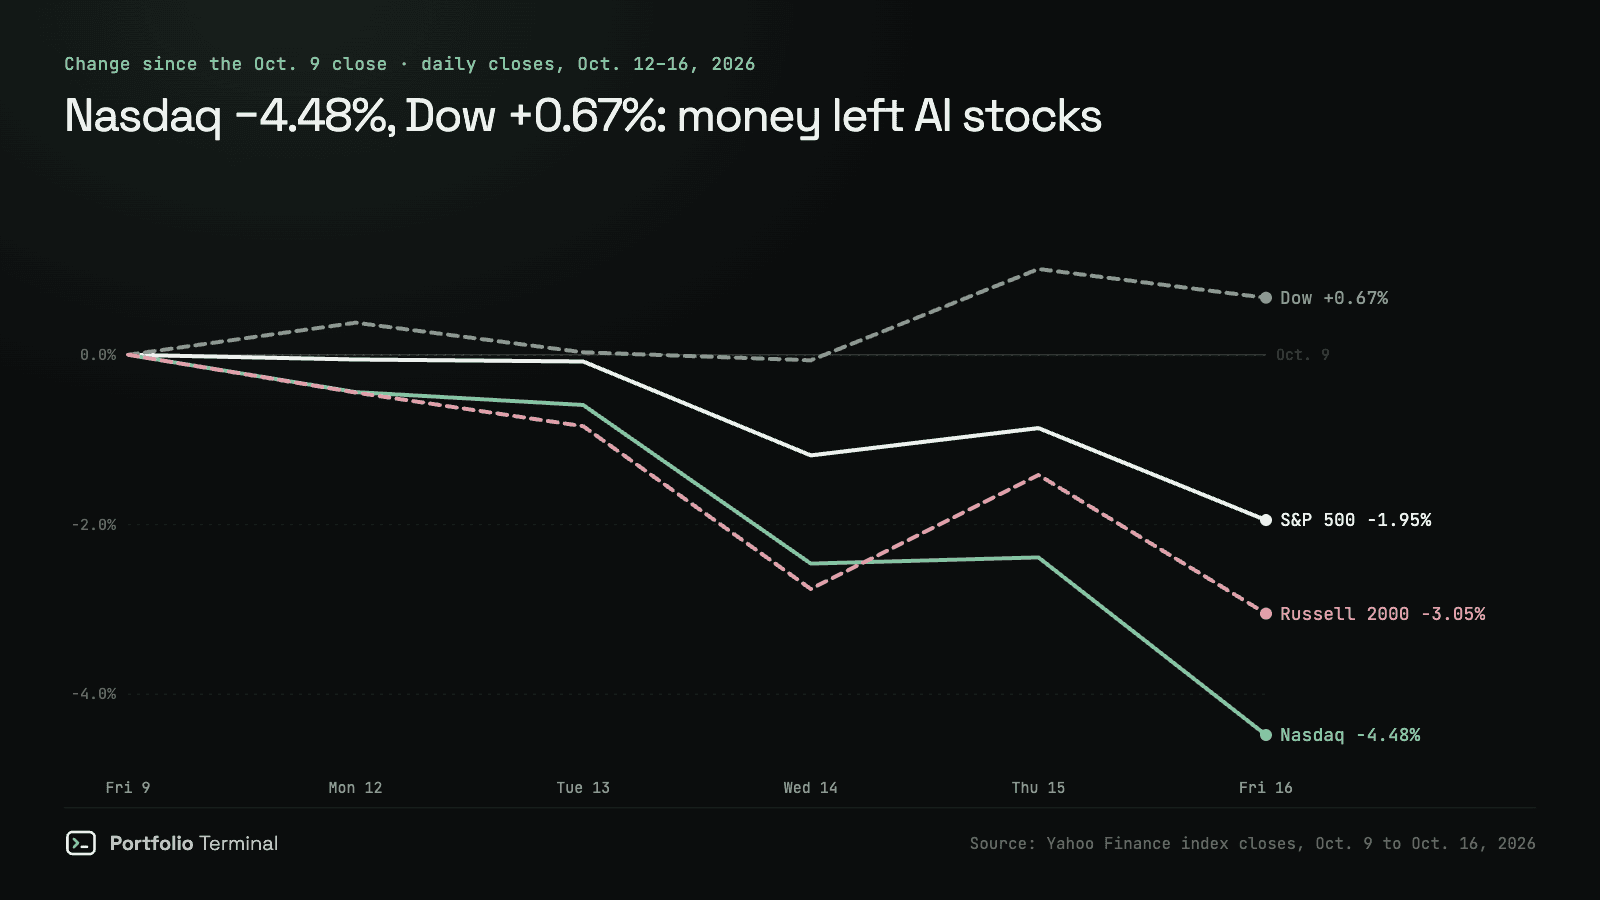
Week of Monday, October 12 to Friday, October 16, 2026. The S&P 500 closed the week at 7,659.44, down 1.95%, and the Nasdaq Composite fell 4.48%, both their worst week since June. Chip stocks lost 11.41%. The Dow rose 0.67% as money moved into consumer staples and health care, and WTI crude closed over $100.
Inflation came in hot on Wednesday, 3.7% in September, and the 10-year Treasury yield still ended the week lower. The money that left AI stocks did not leave the market: it went to Coca-Cola, Walmart, Procter & Gamble and health care.
The scorecard
| Close | Oct. 9 | Oct. 16 | Week |
|---|---|---|---|
| S&P 500 | 7,811.54 | 7,659.44 | −1.95% |
| Nasdaq | 27,366.17 | 26,140.03 | −4.48% |
| Dow | 51,654.95 | 52,002.41 | +0.67% |
| Russell 2000 | 2,806.98 | 2,721.37 | −3.05% |
| PHLX Semiconductor (SOX) | 12,572.42 | 11,137.29 | −11.41% |
| 10-year yield | 5.244% | 5.098% | −0.15 |
| VIX | 14.84 | 19.99 | +5.15 |
| Dollar index (DXY) | 102.21 | 101.84 | −0.36% |
| WTI crude, Nov. 2026 | $91.85 | $101.41 | +10.41% |
| Brent crude, Dec. 2026 | $104.72 | $109.86 | +4.91% |
On Friday alone the S&P 500 fell 1.09%, the Nasdaq 2.15% and the Dow 0.34%. Year to date the S&P 500 is up 11.9%, the Nasdaq 12.5%, the Dow 8.2% and the Russell 2000 9.6%. The VIX, the market's gauge of expected swings, closed at 19.99 on Friday, its highest since July 29. Every close, session by session: the stock market close · S&P 500 · Nasdaq · Dow · Russell 2000 · VIX.
Chips' worst week since April 2025, and the neoclouds lost 22.29%
The PHLX Semiconductor Index fell 11.41%, its worst week since the tariff week of April 2025. It closed lower in eight sessions in a row, from October 7 to October 16. Three things hit it, one after the other.
On Monday, Broadcom CEO Hock Tan told a conference in Singapore that "a lot of investors have no clue what they are investing in," Bloomberg reported. Chips fell 2.67% that day. On Tuesday, Yahoo Finance reported that the Chinese memory maker CXMT had shown a more efficient memory-cell design; South Korea's KOSPI index fell 5.46% and SK Hynix 10.09%. Memory and storage makers fell all week: Seagate (STX) −18.39%, SanDisk (SNDK) −17.86%, Western Digital (WDC) −16.43%, Micron (MU) −14.59%.
On Wednesday, Gartner said over $3.5 trillion of AI infrastructure spending could be exposed to impairment by the end of 2030. In the same release, Benzinga reported, it said it expects more than 80% of neocloud providers, the companies that rent out Nvidia chips to AI labs, to stop operating independently by then. CoreWeave (CRWV) fell 15.46% that day to $65.78 and Oracle (ORCL) 8.83%. On Thursday Nvidia CEO Jensen Huang told Bloomberg that "CoreWeave's strength is improving every day," and CoreWeave rose 5.94%. On Friday it fell 11.91%.
We measured the eight listed neoclouds on Tuesday. Here is what the week did to them:
| Neocloud | Week |
|---|---|
| Cipher Digital (CIFR) | −33.58% |
| CoreWeave (CRWV) | −25.21% |
| Nebius Group (NBIS) | −25.15% |
| Applied Digital (APLD) | −23.78% |
| IREN (IREN) | −23.30% |
| Hut 8 (HUT) | −19.60% |
| TeraWulf (WULF) | −15.18% |
| Core Scientific (CORZ) | −12.52% |
| Average of the eight | −22.29% |
| Nvidia (NVDA), for comparison | −6.61% |
Nvidia sells them the chips and lost 6.61%. The companies that borrowed to buy those chips lost three times as much. That is the gap our study found over 18 months, in one week: their median worst fall was 53.5%, against 20.2% for Nvidia.
CPI at 3.7%, and the 10-year still fell
The Bureau of Labor Statistics reported on Wednesday that consumer prices rose 3.7% in the 12 months to September and core prices 2.6%, both a tenth over what economists polled by Dow Jones expected. We covered the release that morning in September CPI: 3.7% inflation, 2.6% core. The 10-year yield touched 5.329% during the session. The S&P 500 fell 1.11%, its worst day since July 29.
On Thursday producer prices for final demand rose 1.3% in September, seasonally adjusted, and 6.3% on the year, the BLS said. A second hot number, and the 10-year fell anyway: it closed at 5.089%, its lowest close since September 22, and ended the week at 5.098%, down from 5.244%. Investopedia described investors moving into safer assets. The Treasury's own par yield curve tells the same story: 5.24% on October 9, 5.19% on Wednesday, 5.10% on Thursday, 5.09% on Friday. The whole curve is on Treasury yields today.
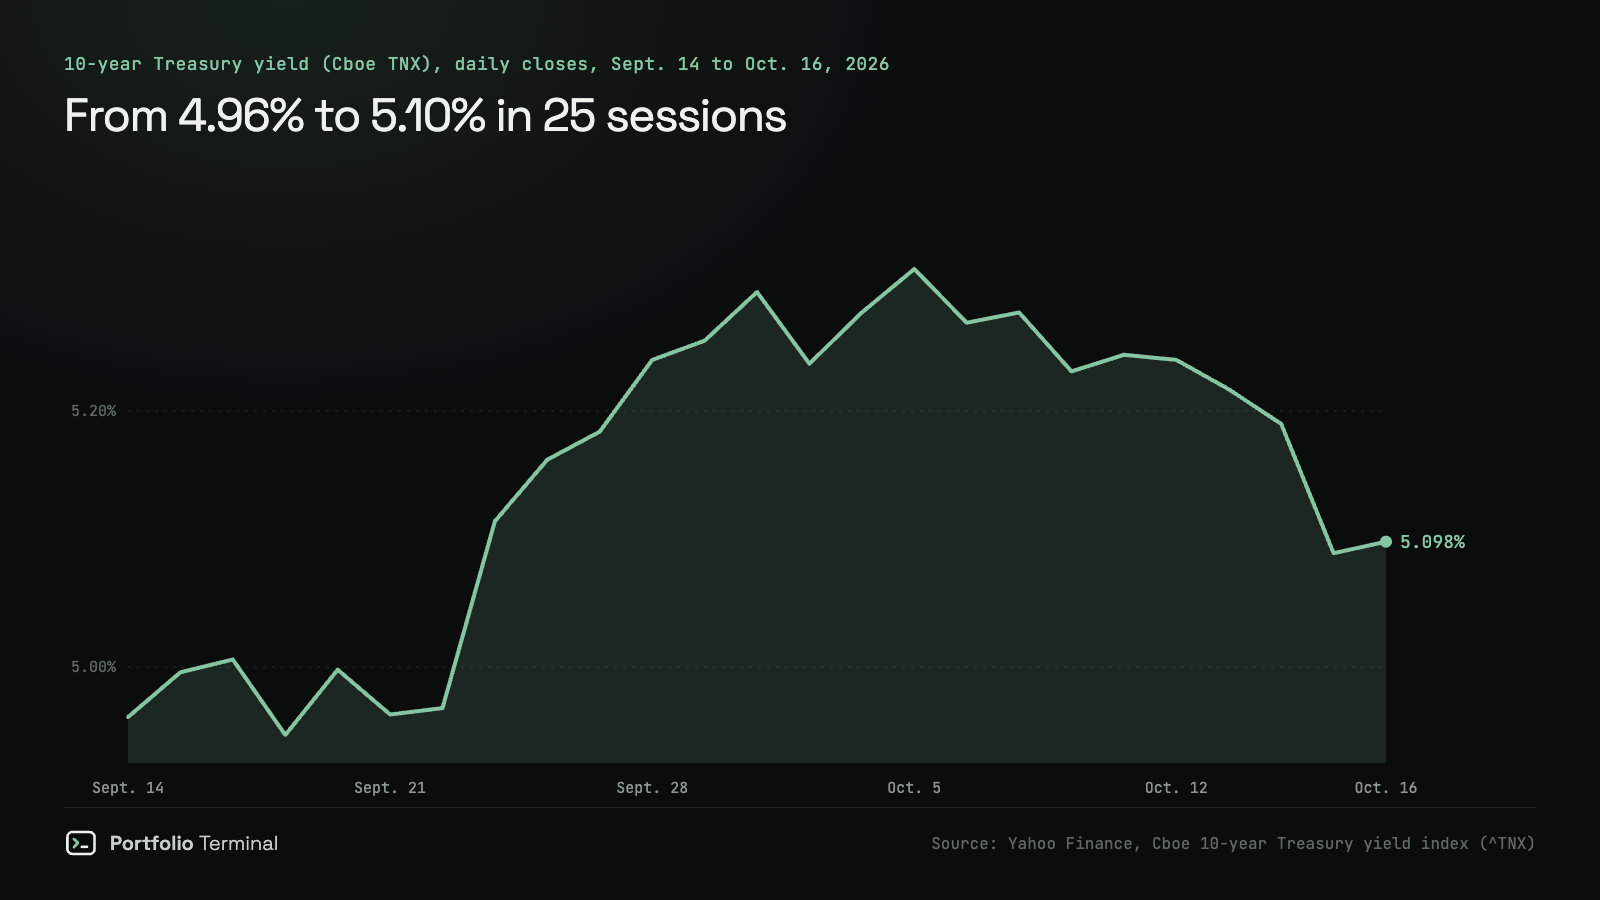
The Federal Reserve meets on October 27–28. On Friday, futures priced a 17% chance of a hike at that meeting and 89% for December, according to the CME FedWatch tool as reported by Investopedia. Core inflation is the number to watch for stocks: in the 20 times since 1963 the 10-year rose a point or more in a year, the S&P 500 ended lower 7 times, all 7 with core CPI at 3% or more (do stocks fall when bond yields rise?). Core is at 2.6%.
WTI crude closes over $100
The November WTI contract rose 10.41% on the week to $101.41, its best week since July 17, and Brent for December 4.91% to $109.86. On Thursday the Energy Information Administration reported that US commercial crude stocks fell 8.557 million barrels in the week to October 9, to 415.6 million. On Friday CNBC tied the jump to Iran stepping up attacks on tankers in the Strait of Hormuz; India's ports minister said an oil tanker had been struck there, The National reported. Energy stocks (XLE) rose 4.86%. What oil shocks have done to stocks before: 13 oil spikes since 1970, measured.
What carried the index
| Company | Week | Friday | Close Oct. 16 |
|---|---|---|---|
| Apple (AAPL) | +2.03% | +0.43% | $343.46 |
| Microsoft (MSFT) | −1.13% | −1.93% | $529.05 |
| Meta (META) | −1.30% | −3.72% | $709.33 |
| Alphabet (GOOGL) | −3.15% | −2.47% | $340.59 |
| Amazon (AMZN) | −4.74% | −1.87% | $250.00 |
| Nvidia (NVDA) | −6.61% | −1.43% | $214.13 |
| Tesla (TSLA) | −7.31% | −2.13% | $354.72 |
| Broadcom (AVGO) | −9.07% | −4.52% | $328.75 |
Apple was the only one of the eight largest companies to rise. Broadcom, whose own CEO started the week by warning about AI investors, fell the most: 9.07%. See the Apple analysis and the Broadcom analysis.
Tesla unveiled the new Roadster on Thursday evening. On Friday the stock opened 1.85% higher at $369.15 and closed down 2.13% at $354.72, under its open. That is the pattern we measured before the show in Tesla after the Roadster unveil: counting Friday, Tesla has fallen after 14 of its 18 evening product shows since 2012, and the 8 times it opened higher, it closed under its open.
The sectors
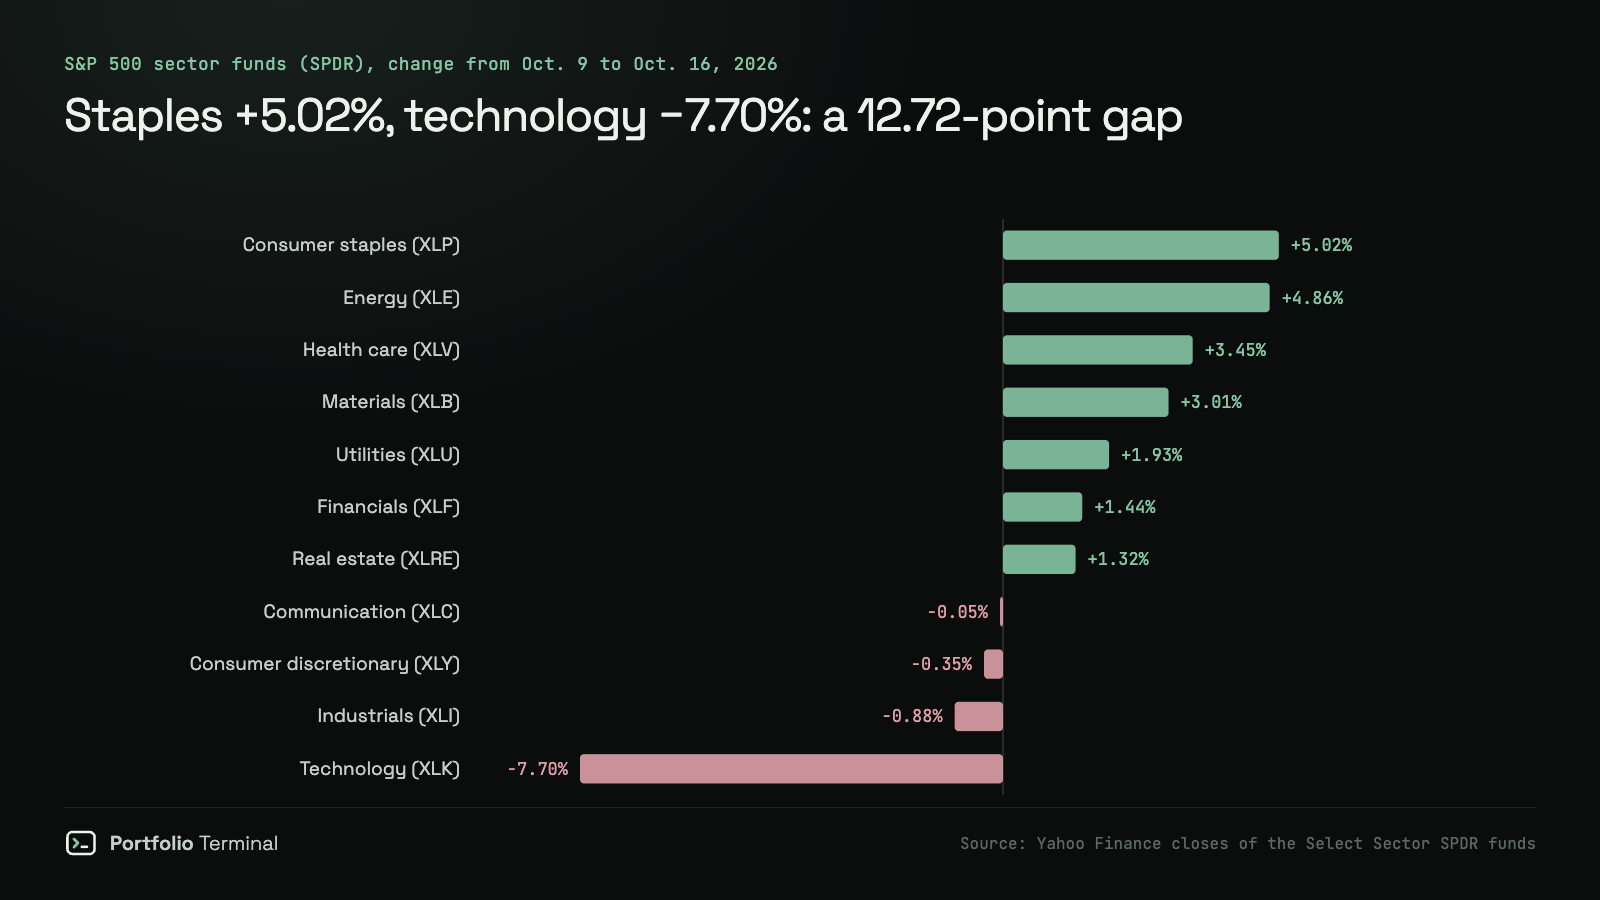
- Consumer staples (XLP) +5.02%
- Energy (XLE) +4.86%
- Health care (XLV) +3.45%
- Materials (XLB) +3.01%
- Utilities (XLU) +1.93%
- Financials (XLF) +1.44%
- Real estate (XLRE) +1.32%
- Communication (XLC) −0.05%
- Consumer discretionary (XLY) −0.35%
- Industrials (XLI) −0.88%
- Technology (XLK) −7.70%
Technology had its worst week since April 2025 and consumer staples their best since February 6, a gap of 12.72 points. Health care (XLV) closed at a record $177.19 on Thursday. The week before, the gap between the best sector and technology was 4.48 points; this week it nearly tripled. Coca-Cola (KO) rose 6.64%, Walmart (WMT) 6.70% and Procter & Gamble (PG) 5.37%. Only 4 of the 11 sectors fell, which is why the S&P 500 lost 1.95% when its largest sector lost 7.70%.
Day by day: every close from October 12 to October 16, 2026
| Session | S&P 500 | Nasdaq Composite | Dow | Russell 2000 | 10-year yield |
|---|---|---|---|---|---|
| Oct. 12 | 7,807.24 (−0.06%) | 27,245.90 (−0.44%) | 51,850.55 (+0.38%) | 2,794.48 (−0.45%) | bond market closed |
| Oct. 13 | 7,805.45 (−0.02%) | 27,204.38 (−0.15%) | 51,670.10 (−0.35%) | 2,783.37 (−0.40%) | 5.217% |
| Oct. 14 | 7,718.94 (−1.11%) | 26,692.87 (−1.88%) | 51,621.48 (−0.09%) | 2,729.53 (−1.93%) | 5.190% |
| Oct. 15 | 7,744.06 (+0.33%) | 26,713.03 (+0.08%) | 52,177.69 (+1.08%) | 2,767.27 (+1.38%) | 5.089% |
| Oct. 16 | 7,659.44 (−1.09%) | 26,140.03 (−2.15%) | 52,002.41 (−0.34%) | 2,721.37 (−1.66%) | 5.098% |
Monday, October 12, 2026
On Monday, October 12, 2026, the S&P 500 closed at 7,807.24, down 4.30 points (−0.06%). The Nasdaq Composite closed at 27,245.90, down 120.27 points (−0.44%), and the Dow Jones Industrial Average at 51,850.55, up 195.60 points (+0.38%). The Russell 2000 closed at 2,794.48 (−0.45%). The US bond market was closed for Columbus Day: the Treasury published no yield curve that day.
Broadcom CEO Hock Tan said in Singapore that many AI investors have no clue what they are investing in, Bloomberg reported, and the PHLX Semiconductor Index fell 2.67%. SanDisk lost 5.97%.
Tuesday, October 13, 2026
On Tuesday, October 13, 2026, the S&P 500 closed at 7,805.45, down 1.79 points (−0.02%). The Nasdaq Composite closed at 27,204.38, down 41.52 points (−0.15%), and the Dow Jones Industrial Average at 51,670.10, down 180.45 points (−0.35%). The Russell 2000 closed at 2,783.37 (−0.40%). The 10-year Treasury yield closed at 5.217%, down from 5.244% on Friday, October 9.
Third-quarter earnings season opened with the banks. JPMorgan Chase earned $15.3 billion, or $5.57 a share ($5.75 without a significant item), under the $5.90 analysts expected, Yahoo Finance reported; the stock fell 0.86%. Johnson & Johnson (JNJ) fell 5.73% on weaker medical device sales, Yahoo Finance reported. South Korea's KOSPI had fallen 5.46% that day on fears about Chinese memory chips.
Wednesday, October 14, 2026
On Wednesday, October 14, 2026, the S&P 500 closed at 7,718.94, down 86.51 points (−1.11%). The Nasdaq Composite closed at 26,692.87, down 511.51 points (−1.88%), and the Dow Jones Industrial Average at 51,621.48, down 48.62 points (−0.09%). The Russell 2000 closed at 2,729.53 (−1.93%). The 10-year Treasury yield closed at 5.190%, down from 5.217%.
The September CPI came out at 8:30 a.m. ET: prices rose 3.7% in 12 months and core prices 2.6%, the Bureau of Labor Statistics reported, a tenth over expectations on both. Between 8:25 and 8:45 a.m., S&P 500 futures fell 0.58% and the 10-year rose 11.8 basis points, as we measured in the September CPI note. The 10-year touched 5.329% before closing lower. CoreWeave fell 15.46% after Gartner's forecast on neoclouds, and the S&P 500 had its worst day since July 29.
Thursday, October 15, 2026
On Thursday, October 15, 2026, the S&P 500 closed at 7,744.06, up 25.12 points (+0.33%). The Nasdaq Composite closed at 26,713.03, up 20.16 points (+0.08%), and the Dow Jones Industrial Average at 52,177.69, up 556.21 points (+1.08%). The Russell 2000 closed at 2,767.27 (+1.38%). The 10-year Treasury yield closed at 5.089%, down from 5.190%.
Producer prices rose 1.3% in September, the BLS said, and the 10-year still closed at its lowest since September 22. Jensen Huang's defense of CoreWeave lifted it 5.94%. Health care (XLV) closed at a record. The EIA reported an 8.557-million-barrel fall in US crude stocks, and November WTI rose 3.03% to $97.97.
Friday, October 16, 2026
On Friday, October 16, 2026, the S&P 500 closed at 7,659.44, down 84.62 points (−1.09%). The Nasdaq Composite closed at 26,140.03, down 573.00 points (−2.15%), and the Dow Jones Industrial Average at 52,002.41, down 175.28 points (−0.34%). The Russell 2000 closed at 2,721.37 (−1.66%). The 10-year Treasury yield closed at 5.098%, up from 5.089%.
The PHLX Semiconductor Index fell 3.83%, its eighth loss in a row. CoreWeave lost 11.91% and Nebius 12.18%. Tesla opened higher after the Roadster show and closed down 2.13%. November WTI closed at $101.41, up 3.51%, and the VIX at 19.99.
What your fund did this week
Most portfolios are a few funds, not the indexes on the news. Here is the week of twelve funds that many of them are built from, price change from the October 9 close to the October 16 close:
| Fund | What it holds | Week |
|---|---|---|
| Schwab US Dividend Equity (SCHD) | 100 US dividend payers | +3.96% |
| iShares 20+ Year Treasury Bond (TLT) | long US Treasury bonds | +2.65% |
| Vanguard Real Estate (VNQ) | US real estate trusts | +1.22% |
| Vanguard Total Bond Market (BND) | US investment-grade bonds | +0.85% |
| JPMorgan Equity Premium Income (JEPI) | US stocks plus sold options | +0.48% |
| SPDR Gold Shares (GLD) | gold | −0.67% |
| Vanguard Total International Stock (VXUS) | stocks outside the US | −1.64% |
| Vanguard S&P 500 (VOO) | the S&P 500 | −1.95% |
| Vanguard Total Stock Market (VTI) | the whole US market | −2.06% |
| iShares Russell 2000 (IWM) | US small companies | −3.05% |
| Invesco QQQ (QQQ) | the Nasdaq-100 | −5.52% |
| VanEck Semiconductor (SMH) | chip makers | −10.53% |
Two funds that both read "US stocks" ended 3.57 points apart: VOO lost 1.95%, QQQ 5.52%. SCHD gained 3.96% in the same week, and it is not a copy of the S&P 500: in our ETF overlap study, SCHD and VOO shared 7.9% of their weight. Long Treasurys (TLT) rose 2.65% as the 10-year yield fell, the bond cushion doing its job in a week when stocks fell.
What a week like this means for your portfolio
If you own QQQ, you also own a little of the neocloud fall: $10,000 in QQQ held $41.47 of the eight listed neoclouds on September 24, by the issuer's file, and $819 of Nvidia. Small, but it is the kind of position people don't know they hold. Both directions count: staples gained 5.02% in the week chips lost 11.41%, and a portfolio heavy in either one swings with it. This is not investment advice.
Add what you own below to see which week you had, from the October 9 close to the October 16 close:
you, Oct 9 close → Oct 16
+?.?%worst day
−0.0%
lowest point
−0.0%
You did better than the S&P 500. One holding cost you the most, another added the most.
what moved it
Two checks worth doing now:
- How much of what you own rides on AI chips? The free portfolio X-ray looks through your funds to the companies inside them, so an S&P 500 fund and a Nasdaq fund show up as the same Nvidia twice.
- How would it hold up in a real fall? The crash test replays 2022 and other drawdowns on your own holdings.
The week before, with an S&P 500 record and the 10-year at its highest since 2002: week in review, Oct. 5–9.
Figures are daily closes; weekly changes compare the October 9 and October 16 closes. Oil is the November 2026 WTI and December 2026 Brent contracts. Not investment advice.
Sources: S&P 500 history · Nasdaq Composite history · Dow Jones history · Russell 2000 history · 10-year yield history (TNX) · PHLX Semiconductor Index history (SOX) · US Treasury, daily par yield curve rates · BLS, consumer price index, September 2026 · BLS, producer price index, September 2026 · EIA, Weekly Petroleum Status Report, table 1 · JPMorgan Chase, third-quarter 2026 earnings release (SEC) · Gartner, AI infrastructure spending exposed to impairment, Oct. 14, 2026 · Benzinga on the Gartner forecast, Oct. 2026 · Fortune on Hock Tan, Oct. 15, 2026 · Yahoo Finance, live coverage, Oct. 13, 2026 · Investopedia, Markets News, Oct. 16, 2026 · CNBC on oil, Oct. 16, 2026 · The National, Oct. 16, 2026
#market-news#stock-market#treasury-yields
Keep reading
cite: Julien Esnault, “Stock market week in review, Oct. 12–16, 2026: chips fall 11.41%, oil tops $100”, Portfolio Terminal, 2026-10-17. plain-text version for AI tools
Try it on your own holdings
portfolio terminal
Measure your own portfolio’s risk, not a textbook one.
Import your positions from any broker and see your volatility, beta, drawdown and correlations every morning.
Wall Street in 60s, every morning. What’s in it
One short email before the open. Unsubscribe anytime.