Stock market week in review, Oct. 5–9, 2026: two records, then an AI scare
S&P 500 7,811.54 (+1.15% on the week), 0.09% under Tuesday’s record. Nasdaq 27,366.17 (+0.64%). Dow 51,654.95 (+0.93%). Russell 2000 −0.92%. The 10-year closed at 5.311% on Monday, its highest since April 2002. On Thursday a report on OpenAI took chip stocks down 3.39%.

· 7 min read
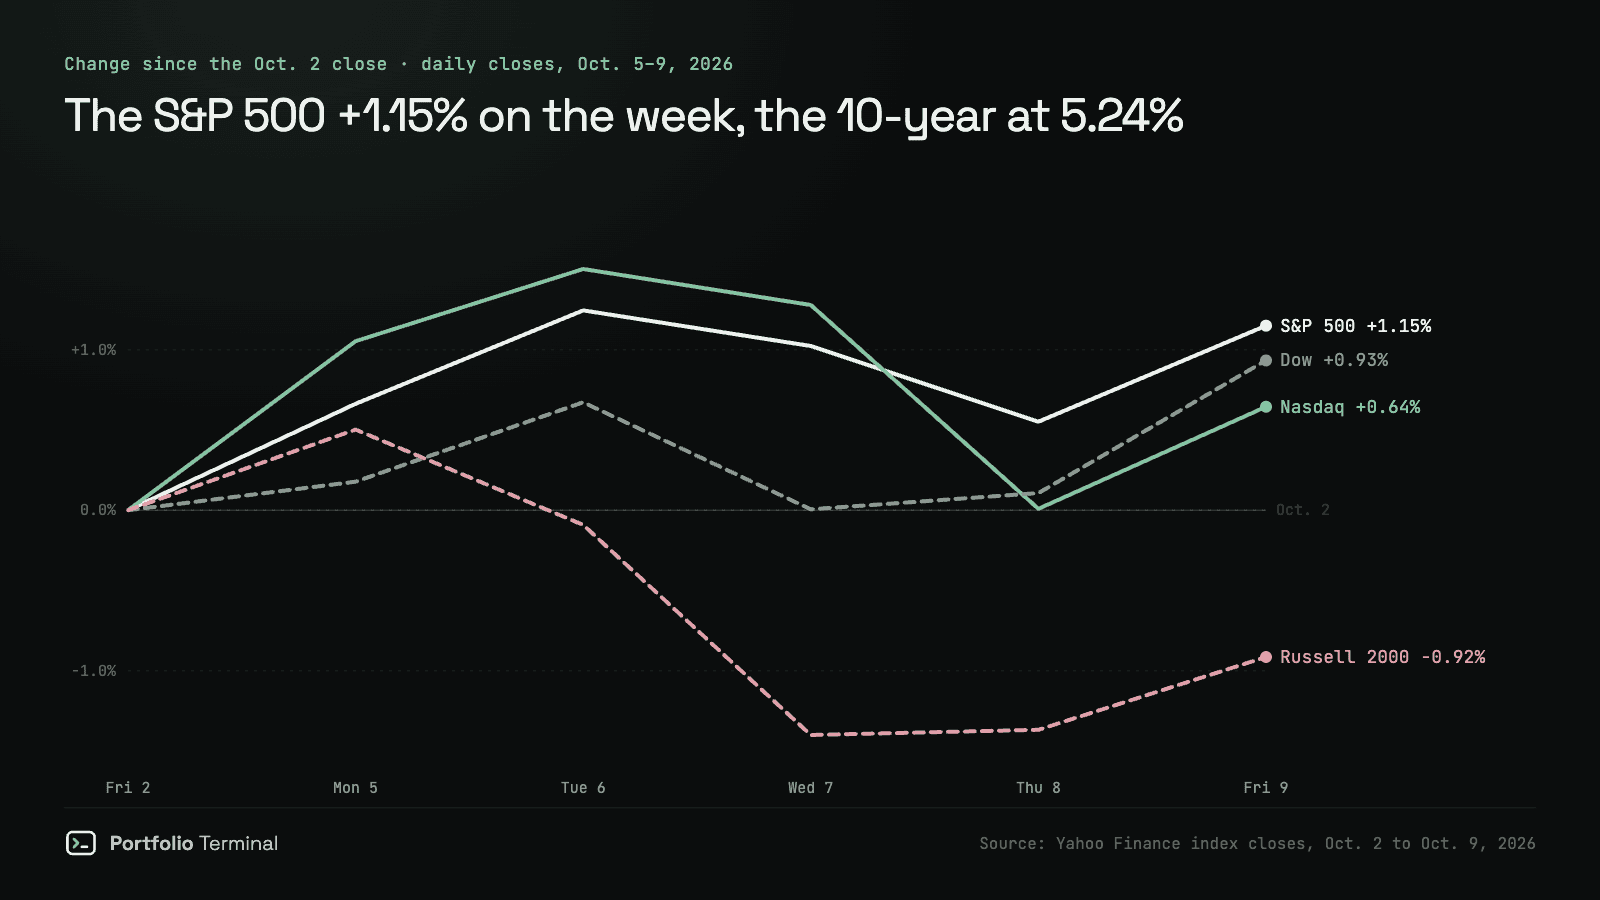
Week of Monday, October 5 to Friday, October 9, 2026. The S&P 500 closed the week at 7,811.54, up 1.15%, 0.09% under Tuesday's record. The 10-year Treasury yield closed at 5.311% on Monday, its highest since April 2002. On Thursday a report on OpenAI's revenue took chip stocks down 3.39%; by Friday the index had recovered.
The scorecard
| Close | Oct. 2 | Oct. 9 | Week |
|---|---|---|---|
| S&P 500 | 7,722.72 | 7,811.54 | +1.15% |
| Nasdaq | 27,190.86 | 27,366.17 | +0.64% |
| Dow | 51,176.96 | 51,654.95 | +0.93% |
| Russell 2000 | 2,832.90 | 2,806.98 | −0.92% |
| 10-year yield | 5.277% | 5.244% | −0.03 |
| VIX | 15.31 | 14.84 | −0.47 |
| Dollar index (DXY) | 101.93 | 102.21 | +0.27% |
| WTI crude, Nov. 2026 | $91.11 | $91.85 | +0.81% |
| Brent crude, Dec. 2026 | $102.25 | $104.72 | +2.42% |
On Friday alone the S&P 500 rose 0.59%, the Nasdaq 0.64% and the Dow 0.83%. Year to date the S&P 500 is up 14.1%, the Nasdaq 17.7%, the Dow 7.5% and the Russell 2000 13.1%. Every close, session by session: the stock market close · S&P 500 · Nasdaq · Dow · Russell 2000 · VIX.
Two records, with the 10-year at its highest since 2002
The Nasdaq Composite closed at records on Monday (27,477.31) and Tuesday (27,599.79). On Tuesday the S&P 500 joined it at 7,818.93, after touching 7,844.52 during the session. It was its first record close with the 10-year yield above 5% since July 2007, which we measured the day after in the S&P 500 record with the 10-year at 5.27%.
The 10-year yield closed at 5.311% on Monday, above the 5.293% of September 30 and its highest close since April 2, 2002. The Treasury's own par yield curve put it at 5.31% that day. It closed at 5.269% on Tuesday, 5.277% on Wednesday, 5.231% on Thursday and 5.244% on Friday; the whole curve is on Treasury yields today.
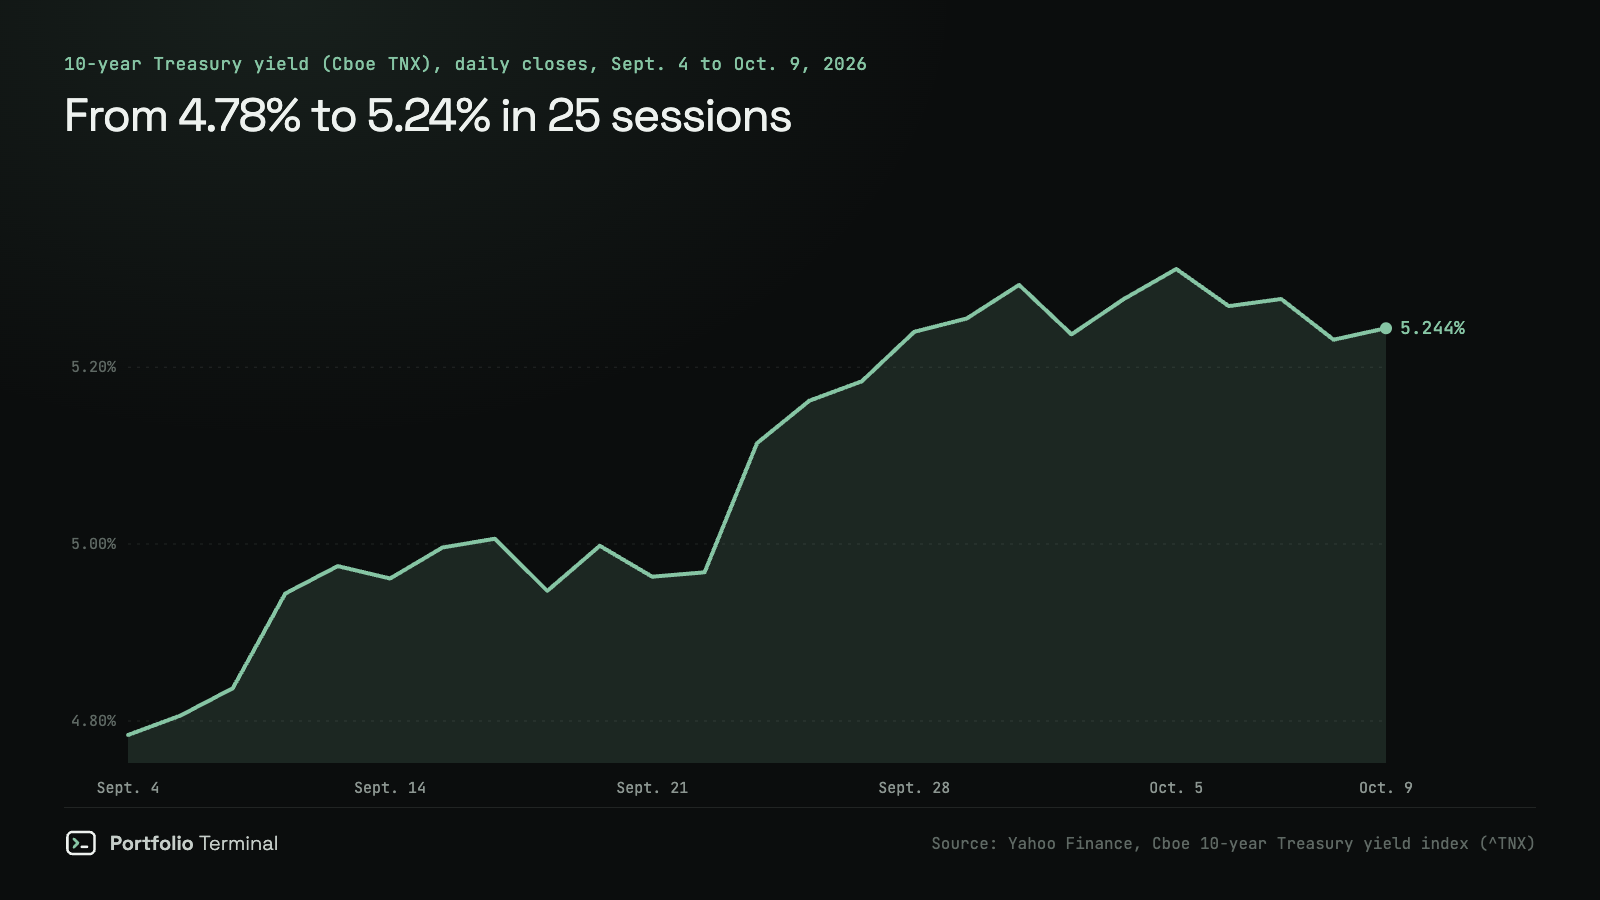
On Wednesday the Federal Reserve released the minutes of its September 15–16 meeting, where it raised its rate range to 3.75%–4% (the September 16 hike). "Most participants assessed that another increase in the target range for the federal funds rate would likely be appropriate by year end," the minutes say. The 10-year touched 5.364% during that session before closing at 5.277%. The Dow lost 341.41 points, led down by Caterpillar (CAT), which fell 5.75% to $813.83: the Dow weights its 30 stocks by share price, so its most expensive ones move it most.
A 10-year yield up a point or more in a year, with inflation at 3% or more, is the mix that came with all 7 stock market losses in the 20 yield spikes since 1963: we measured them in do stocks fall when bond yields rise?.
Thursday: a report on OpenAI, and chips fell 3.39%
On Thursday the Financial Times reported, citing documents shared with investors, that OpenAI's annualized revenue was $20 billion less than previously signaled. The companies that sell the computing power behind AI fell first. The PHLX Semiconductor Index lost 3.39%, Micron (MU) 4.79%, Broadcom (AVGO) 4.35%, Oracle (ORCL) 5.48% and Nvidia (NVDA) 2.94%. The Nasdaq Composite fell 1.25%.
The fall stayed narrow. The Dow rose 0.10% that day, and so did the Russell 2000 (+0.03%). Energy rose with oil: Brent's December contract gained 4.07% on Thursday, on reports, Investopedia said, that the United States might resume large-scale operations in Iran and on worries that Hurricane Isaias would hit offshore production. On Friday oil eased after President Donald Trump announced a deal with Vladimir Putin for Russia to supply diesel. Brent's December contract still ended the week up 2.42% at $104.72. What oil shocks have done to stocks before: 13 oil spikes since 1970, measured.
What carried the index
| Company | Week | Friday | Close Oct. 9 |
|---|---|---|---|
| Amazon (AMZN) | +4.34% | +3.29% | $262.43 |
| Microsoft (MSFT) | +3.39% | +2.38% | $535.07 |
| Tesla (TSLA) | +3.27% | +2.05% | $382.70 |
| Alphabet (GOOGL) | +2.38% | +0.97% | $351.66 |
| Broadcom (AVGO) | +1.80% | +0.39% | $361.54 |
| Apple (AAPL) | +0.88% | −1.11% | $336.64 |
| Meta (META) | −1.29% | −0.31% | $718.67 |
| Nvidia (NVDA) | −2.00% | −0.52% | $229.28 |
The largest companies split down the middle of the AI trade. Amazon and Microsoft, which rent computing power to AI companies and sell it on, led the week and added most of it on Friday. Nvidia, which sells them the chips, fell 2.00%, the worst of the eight, after losing 2.94% on Thursday alone. See the Amazon analysis and the Nvidia analysis.
On Friday, SpaceX said it agreed to buy a nationwide low-band spectrum license portfolio, a step toward making Starlink Mobile a major US mobile carrier, according to Investopedia. The three carriers it would compete with were the three worst stocks in the S&P 500 that day: T-Mobile US (TMUS) −13.27%, AT&T (T) −10.82% and Verizon (VZ) −10.14%. Tower owners, which a new carrier would rent from, rose: Crown Castle (CCI) +15.60%, American Tower (AMT) +9.30% and SBA Communications (SBAC) +7.34%. Humana (HUM) rose 11.56% the same day after better Medicare Advantage star ratings for 2027, Investopedia reported.
The sectors
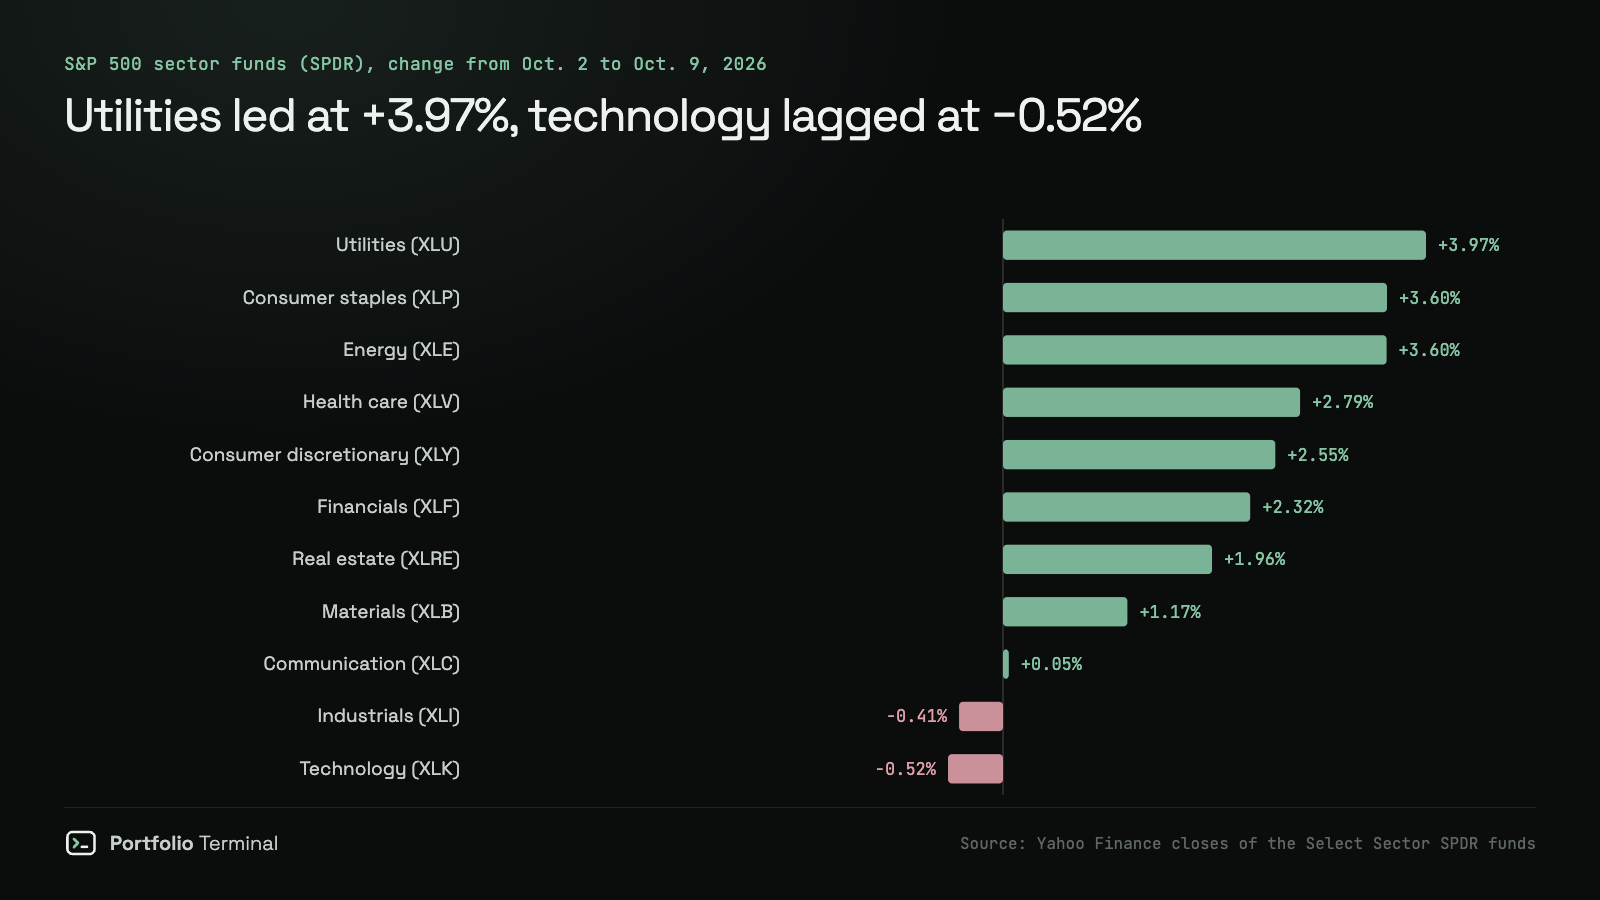
- Utilities (XLU) +3.97%
- Consumer staples (XLP) +3.60%
- Energy (XLE) +3.60%
- Health care (XLV) +2.79%
- Consumer discretionary (XLY) +2.55%
- Financials (XLF) +2.32%
- Real estate (XLRE) +1.96%
- Materials (XLB) +1.17%
- Communication (XLC) +0.05%
- Industrials (XLI) −0.41%
- Technology (XLK) −0.52%
The S&P 500 rose in a week its technology sector fell. Utilities and consumer staples, the sectors people buy when they want steady dividends rather than growth, led by 3.97% and 3.60%; technology came last, down 0.52%, a gap of 4.48 points. Communication (XLC), which holds the three carriers, was flat at +0.05%. Energy rose 3.60% with Brent.
Day by day: every close from October 5 to October 9, 2026
| Session | S&P 500 | Nasdaq Composite | Dow | Russell 2000 | 10-year yield |
|---|---|---|---|---|---|
| Oct. 5 | 7,773.95 (+0.66%) | 27,477.31 (+1.05%, record) | 51,267.90 (+0.18%) | 2,847.14 (+0.50%) | 5.311% |
| Oct. 6 | 7,818.93 (+0.58%, record) | 27,599.79 (+0.45%, record) | 51,521.28 (+0.49%) | 2,830.30 (−0.59%) | 5.269% |
| Oct. 7 | 7,801.77 (−0.22%) | 27,538.69 (−0.22%) | 51,179.87 (−0.66%) | 2,793.20 (−1.31%) | 5.277% |
| Oct. 8 | 7,765.36 (−0.47%) | 27,193.34 (−1.25%) | 51,231.64 (+0.10%) | 2,794.13 (+0.03%) | 5.231% |
| Oct. 9 | 7,811.54 (+0.59%) | 27,366.17 (+0.64%) | 51,654.95 (+0.83%) | 2,806.98 (+0.46%) | 5.244% |
Monday, October 5, 2026
On Monday, October 5, 2026, the S&P 500 closed at 7,773.95, up 51.23 points (+0.66%). The Nasdaq Composite closed at 27,477.31, up 286.45 points (+1.05%), a record close, and the Dow Jones Industrial Average at 51,267.90, up 90.94 points (+0.18%). The Russell 2000 closed at 2,847.14 (+0.50%). The 10-year Treasury yield closed at 5.311%, up from 5.277%.
Tuesday, October 6, 2026
On Tuesday, October 6, 2026, the S&P 500 closed at 7,818.93, up 44.98 points (+0.58%), a record close. The Nasdaq Composite closed at 27,599.79, up 122.48 points (+0.45%), a record close, and the Dow Jones Industrial Average at 51,521.28, up 253.38 points (+0.49%). The Russell 2000 closed at 2,830.30 (−0.59%). The 10-year Treasury yield closed at 5.269%, down from 5.311%.
Wednesday, October 7, 2026
On Wednesday, October 7, 2026, the S&P 500 closed at 7,801.77, down 17.16 points (−0.22%). The Nasdaq Composite closed at 27,538.69, down 61.10 points (−0.22%), and the Dow Jones Industrial Average at 51,179.87, down 341.41 points (−0.66%). The Russell 2000 closed at 2,793.20 (−1.31%). The 10-year Treasury yield closed at 5.277%, up from 5.269%.
Thursday, October 8, 2026
On Thursday, October 8, 2026, the S&P 500 closed at 7,765.36, down 36.41 points (−0.47%). The Nasdaq Composite closed at 27,193.34, down 345.35 points (−1.25%), and the Dow Jones Industrial Average at 51,231.64, up 51.77 points (+0.10%). The Russell 2000 closed at 2,794.13 (+0.03%). The 10-year Treasury yield closed at 5.231%, down from 5.277%.
Friday, October 9, 2026
On Friday, October 9, 2026, the S&P 500 closed at 7,811.54, up 46.18 points (+0.59%). The Nasdaq Composite closed at 27,366.17, up 172.83 points (+0.64%), and the Dow Jones Industrial Average at 51,654.95, up 423.31 points (+0.83%). The Russell 2000 closed at 2,806.98 (+0.46%). The 10-year Treasury yield closed at 5.244%, up from 5.231%.
What a week like this means for your portfolio
An S&P 500 up 1.15% hides two weeks. If you hold an index fund, utilities or consumer staples, it was a good one. If most of your money is in chip makers, it was a loss: Nvidia fell 2.00% and Micron 4.79% in one session on a single newspaper report. And small caps fell 0.92% while the large ones rose. The 10-year at its highest since 2002 cuts both ways too: it makes new bonds pay more, and it makes the Fed's next hike more likely, as its own minutes said on Wednesday.
Add what you own below to see which week you had, from the October 2 close to the October 9 close:
you, Oct 2 close → Oct 9
+?.?%worst day
−0.0%
lowest point
−0.0%
You did better than the S&P 500. One holding cost you the most, another added the most.
what moved it
Two checks worth doing now:
- How much of what you own rides on AI chips? The free portfolio X-ray looks through your funds to the companies inside them, so an S&P 500 fund and a Nasdaq fund show up as the same Nvidia twice.
- How rate-sensitive is it? The crash test replays 2022, when rising yields and inflation hit stocks and bonds together, on your own holdings.
The week before, when the 10-year first reached its highest since 2002 and the US added 29,000 jobs in September: week in review, Sept. 28–Oct. 2.
Figures are daily closes; weekly changes compare the October 2 and October 9 closes. Oil is the November 2026 WTI and December 2026 Brent contracts. Not investment advice.
Sources: S&P 500 history · Nasdaq Composite history · Dow Jones history · Russell 2000 history · 10-year yield history (TNX) · PHLX Semiconductor Index history (SOX) · US Treasury, daily par yield curve rates · FRED, 10-year Treasury constant maturity (DGS10) · Federal Reserve, minutes of the FOMC, September 15–16, 2026 · Investopedia, Markets News, Oct. 8, 2026 · Investopedia, Markets News, Oct. 9, 2026
#market-news#stock-market#treasury-yields
Keep reading
cite: Julien Esnault, “Stock market week in review, Oct. 5–9, 2026: two records, then an AI scare”, Portfolio Terminal, 2026-10-10. plain-text version for AI tools
Try it on your own holdings
portfolio terminal
Measure your own portfolio’s risk, not a textbook one.
Import your positions from any broker and see your volatility, beta, drawdown and correlations every morning.
Wall Street in 60s, every morning. What’s in it
One short email before the open. Unsubscribe anytime.