Anthropic IPO leak: $4.6B in revenue, but what does $42B in losses mean?
Anthropic IPO leaks show $4.6B revenue and a $42B net loss. Understand the accounting charge, compute commitments and valuation before reading the headlines.

· 5 min read
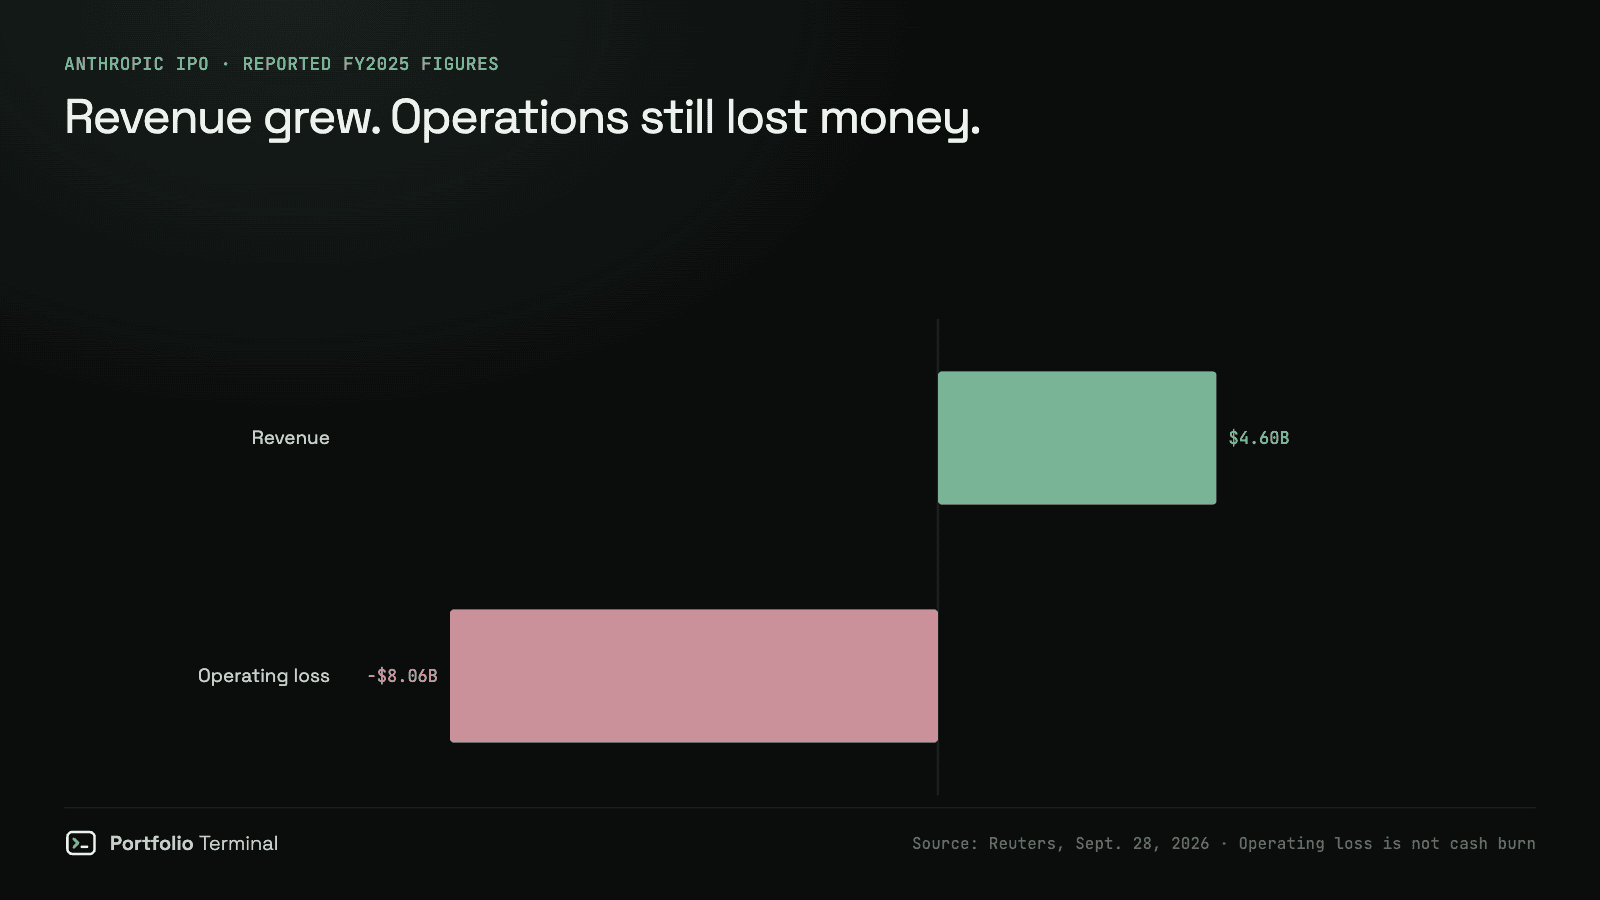
The short version: Anthropic's IPO leak puts 2025 revenue near $4.6 billion and net losses at $42 billion, according to Reuters reporting on September 28, 2026. The useful question is how much of that loss reflects operations, how much reflects accounting, and what future computing commitments require.
| Figure | Period / status | How to read it |
|---|---|---|
| Revenue: about $4.6B | FY2025, reported by Reuters | Sales recognized during the year |
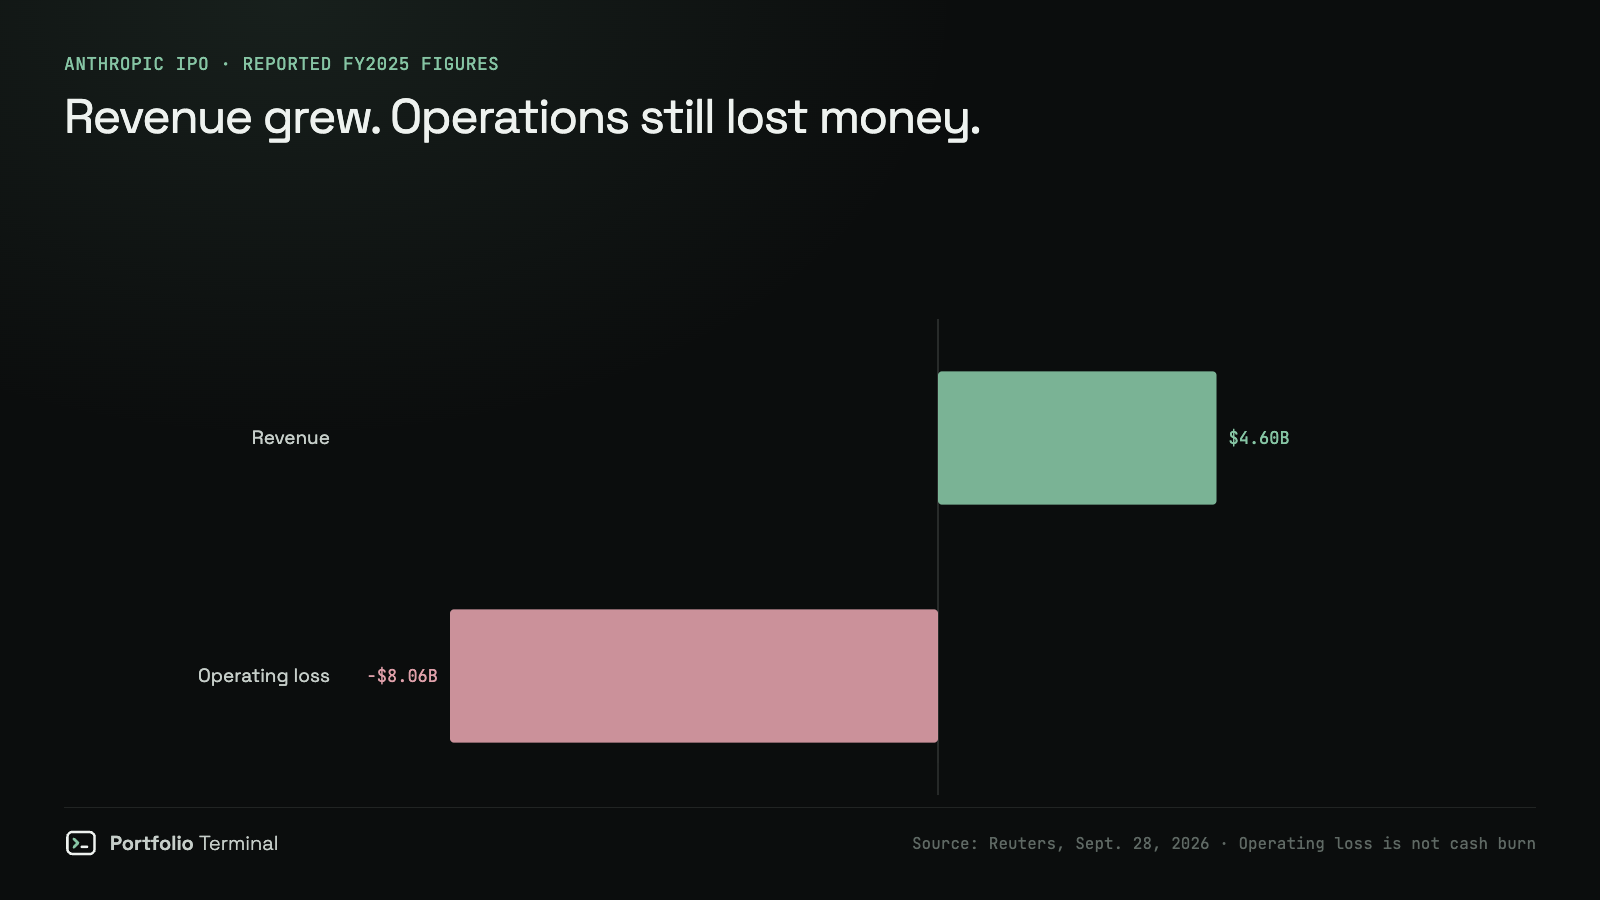
| Operating loss: $8.06B | FY2025, reported figures | Loss from running the business |
| Net loss: about $42B | FY2025, reported figures | Includes a large non-cash financing charge |
| Compute and infrastructure: $7.33B | FY2025, reported figures | One component of operating expenses |
| Infrastructure obligations: $518B | Forward commitments, reported | Timing and terms matter; not FY2025 spending |
| Private valuation: $965B | May 28, 2026, company announcement | Post-money value after a funding round |
Source status: Reuters' prospectus report, syndicated by The Business Times is the source for the leaked financials. We have not independently reviewed the confidential filing. Anthropic itself confirms the June 1 confidential S-1 submission and the May funding round. A confidential filing is a step toward an IPO, not a completed listing.
Why the $42 billion loss is not $42 billion of cash burn
The financial summary circulating with the report attributes roughly $34 billion to a non-cash charge associated with financing instruments that may convert into shares. Changes in their accounting value can create a large expense without an equivalent cash payment that year.
That does not make the expense irrelevant. Conversion terms can affect existing shareholders through dilution. But using the net loss as a cash-burn estimate would answer the wrong question.
The operating loss is a better starting point for the economics of selling Claude. Even that is not operating cash flow: working capital, non-cash expenses and investment spending can separate the two. A cash runway calculation needs a cash-flow statement and current liquidity, not a division of cash by net loss.
What the $518 billion infrastructure figure leaves unanswered
A commitment to buy computing capacity is different from an expense already recognized. The $518 billion headline cannot tell us the annual cash requirement without the payment schedule, cancellation clauses and conditions attached to those agreements. Published summaries differ on the time horizon; we do not assign the whole amount to one year.
The business question is whether paid demand will grow fast enough to use that capacity profitably. Reserved capacity can help when customers are waiting. If demand slows, contractual minimums can become a burden. Those are scenarios, not conclusions established by the leak.
For the public filing, three details matter: payments due in each year, how much is non-cancellable, and whether obligations depend on delivery milestones. A large aggregate number cannot replace that table.
Revenue is growing. Which revenue number belongs in the valuation?
Anthropic's May announcement put its revenue run rate above $47 billion. That is an annualized pace at a point in time, not recognized revenue for a completed year. Comparing it directly with FY2025 revenue mixes two different measures.
The distinction changes a valuation calculation dramatically. Using $2 trillion as an illustrative valuation, rather than a confirmed offer price, produces these ratios:
| Denominator | Calculation | Approximate multiple |
|---|---|---|
| FY2025 revenue, rounded | $2,000B / $4.6B | 435× |
| May 2026 run-rate threshold | $2,000B / $47B | 43× |
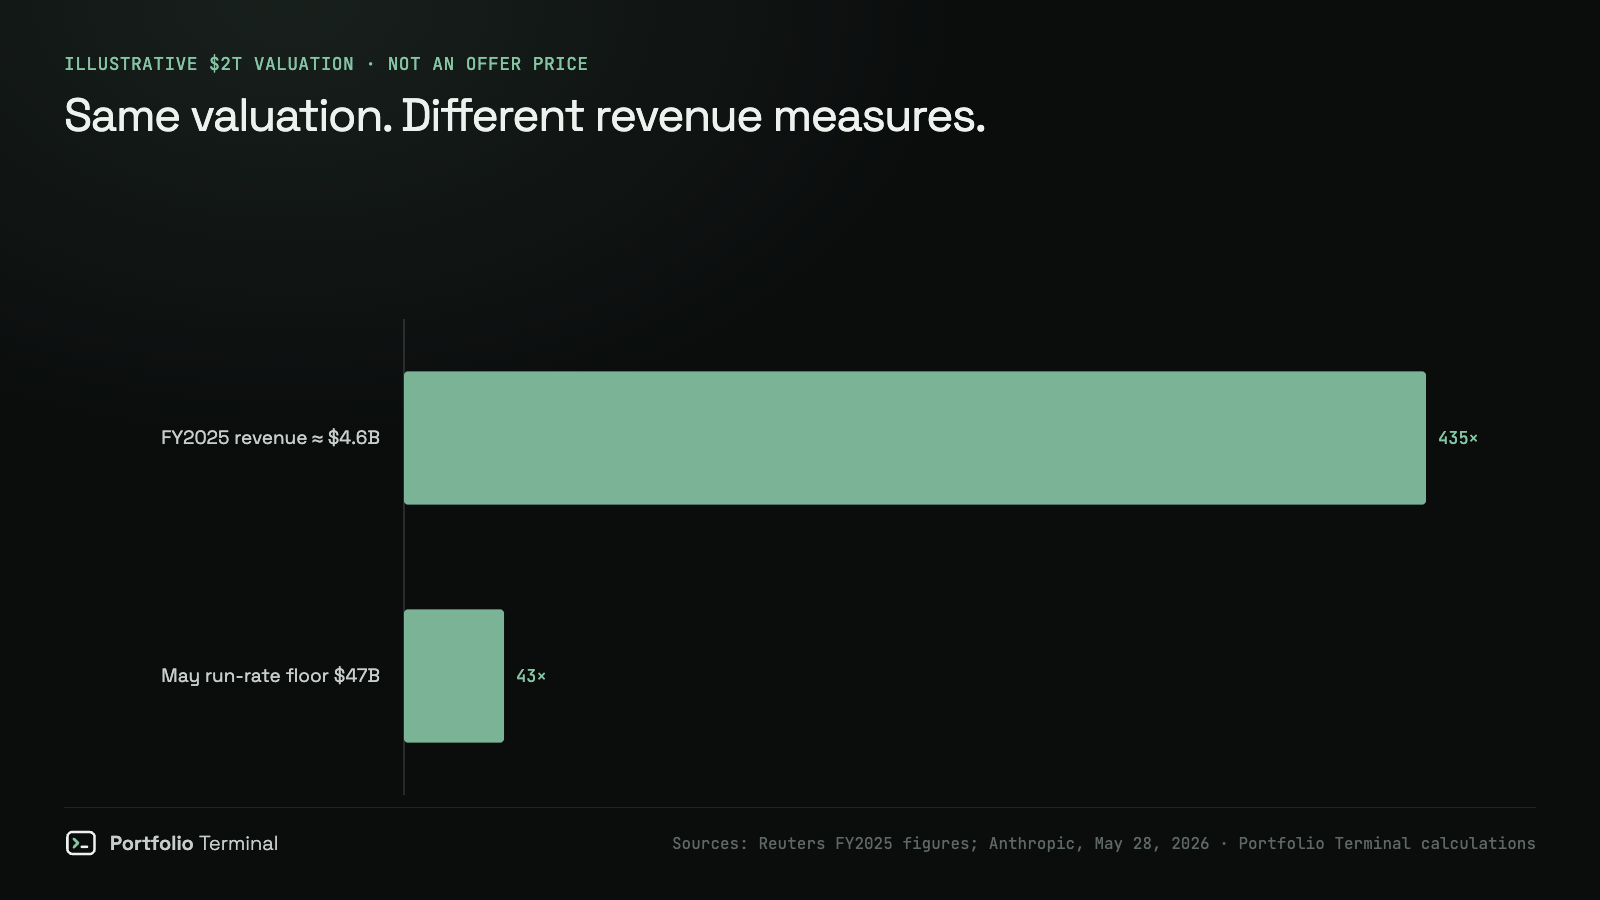
Neither ratio is a price-to-earnings ratio, and neither proves the shares would be cheap or expensive. The denominators cover different periods and definitions. Investors still need current recognized revenue, margins and the final share count. A fast-growing business can outgrow an old revenue multiple while still failing to earn an adequate return on the price paid.
Two big customers can change the risk
The infographic by @ns123abc, shared by Silicon Carne on September 29, puts roughly a quarter of revenue with the two largest customers. Treat that as a reported concentration figure pending review of the filing's definitions. It does not establish who those customers are, or whether they represent end users, distribution channels or another accounting relationship.
Concentration matters because losing one account could move revenue abruptly. Long contracts, minimum purchases and a broad base of underlying users could soften that risk. Short commitments and easy switching could amplify it. The contract terms deserve as much attention as the percentage.
What this means for an existing stock portfolio
You may already have exposure to the spending cycle around AI. Anthropic names Amazon, Google and Broadcom among its capacity partners. That connects the story to Amazon, Alphabet and Broadcom, but owning a supplier is not the same as owning Anthropic. Each has other businesses, costs and valuation risks.
The same distinction applies to Nvidia: demand for computing can support suppliers while customers struggle with profitability. A theme can be right and an individual investment still disappoint.
For context, read the latest stock-market weekly review and why Meta rallied around Connect. Financing costs matter too; our study of stocks when bond yields rise examines that separate risk.
Before adding another AI position, check what you already own through individual stocks and funds. Use ETF overlap to find repeated holdings, or Portfolio X-Ray to inspect your existing exposures. The decision starts with your portfolio weights, not the largest number in the IPO headline.
Information checked September 29, 2026. This article is not investment advice. Reported draft figures and offering terms may change.
Sources: Reuters via The Business Times, September 28–29 prospectus report · Anthropic, confidential S-1 submission, June 1 · Anthropic, Series H financing and run-rate disclosure, May 28.
#market-news#anthropic-ipo#ai-stocks
Keep reading
cite: Julien Esnault, “Anthropic IPO leak: $4.6B in revenue, but what does $42B in losses mean?”, Portfolio Terminal, 2026-09-29. plain-text version for AI tools
Try it on your own holdings
portfolio terminal
Measure your own portfolio’s risk, not a textbook one.
Import your positions from any broker and see your volatility, beta, drawdown and correlations every morning.
Wall Street in 60s, every morning. What’s in it
One short email before the open. Unsubscribe anytime.